Goal
This project was completed as part of my Professional Diploma in UX Design credit-rated by Glasgow Caledonia University.
The goal of the project was to improve the user experience on the airline app and make the flight booking process as simple and efficient as possible.
My role
- I conducted a UX research and adopted different methods to uncover problems and design opportunities
- As a part of a UX research analysis, I categorized, classified, and organized the row data I’ve gathered to turn this into insights and design decisions
- I designed sketches and a prototype
- To validate my design ideas, I conducted a usability test of the prototype
- Finally, I created wireframes containing all the necessary detail a developer would need to build the application accurately
Result
I created a medium fidelity prototype highly appreciated during usability tests. Finally, I got to see all my UX efforts built into a functioning prototype!
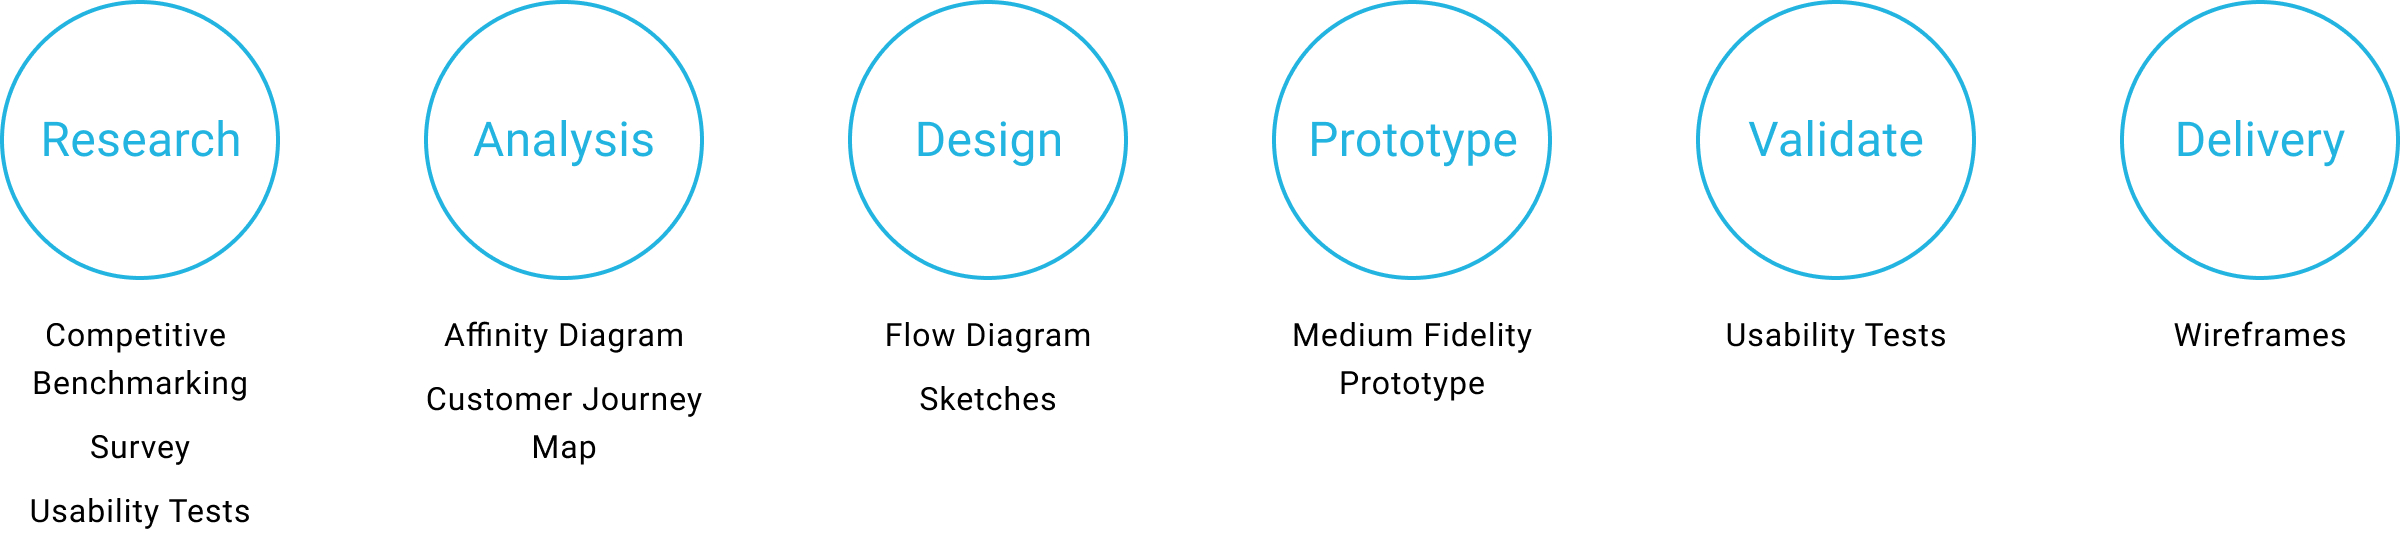
Process
Tools used
Research
Competitive Benchmarking
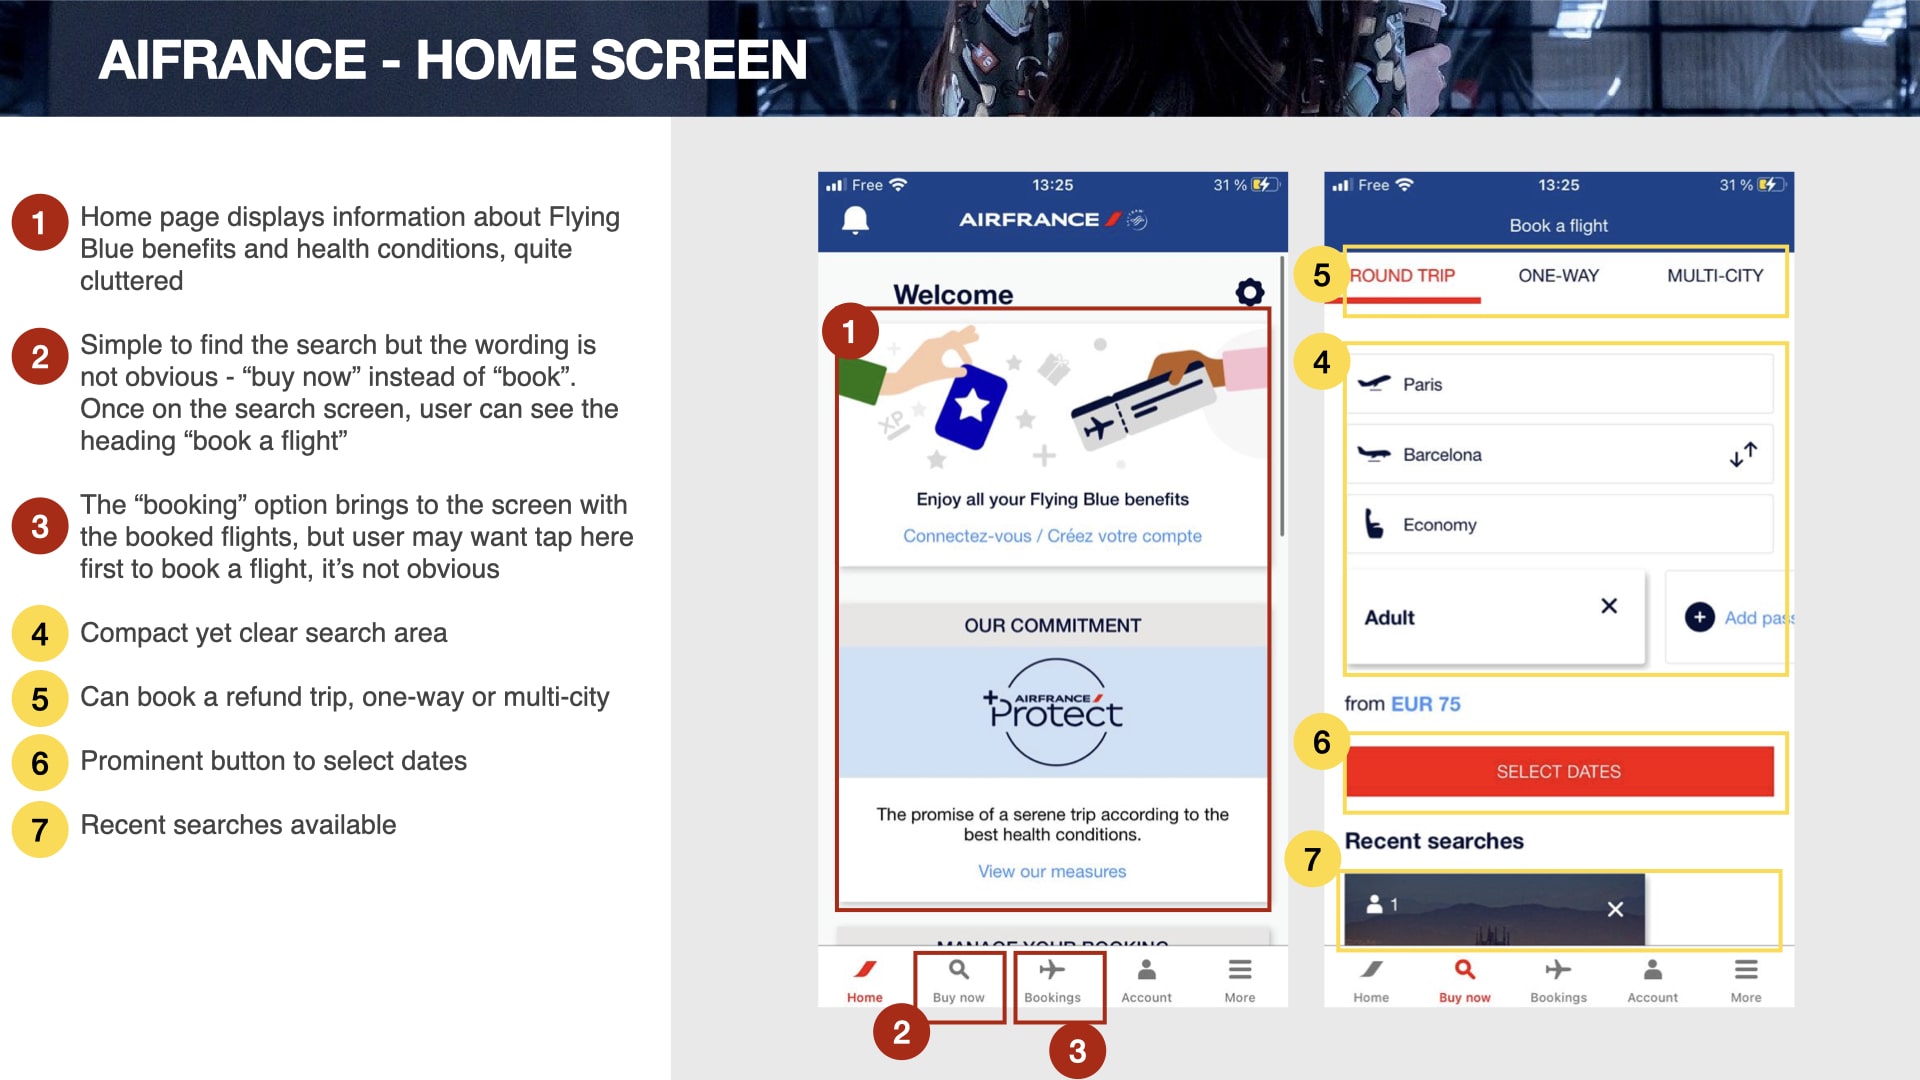
Performing a competitive analysis helped me identify competitors’ strengths and weaknesses in terms of user experience relative to their own business. I reviewed the native apps of each of the following airline companies: Air France, Lufthansa, Finnair and also the app of the travel fare aggregator Momondo.
Through my research I discovered how well known apps manage the booking process online and noted the conventions to follow. I also made note of best practice to emulate and learnt from what the selected apps are doing wrong. After the competitive benchmarking I got a better idea of what I should avoid and implement in an airline app to create a smooth booking process. The next step was to verify if users thought the same way during usability tests.
Conventions
I identified various conventions in the apps I reviewed. The main ones that really stuck out were:
- Compact yet clear search area
- Recent searches available
- Quick review of flight details before payment
- Sign in not mandatory to access to the booking process
Best practices
There were also best practices in all the apps, in particular:
- Breakdown on the calendar view, “switch” button in the search area to switch “from”/“to” cities
- Prominent route summery feedback, prominent “back” button
- Information related to the user’s origin country automatically picked up – departure cities, phone code
- Information bubbles to guide users through the steps
- Intuitive selection and removal of flight options
Pain points/opportunities
These were pain points I found in the apps I reviewed:
- No clear and simple way to compare prices
- Not obvious where to tap to select an option (button)
- User not provided with information popups (about connecting flights)
- Entered contact details not memorized
- Not easy for the user to filter and compare flight fares

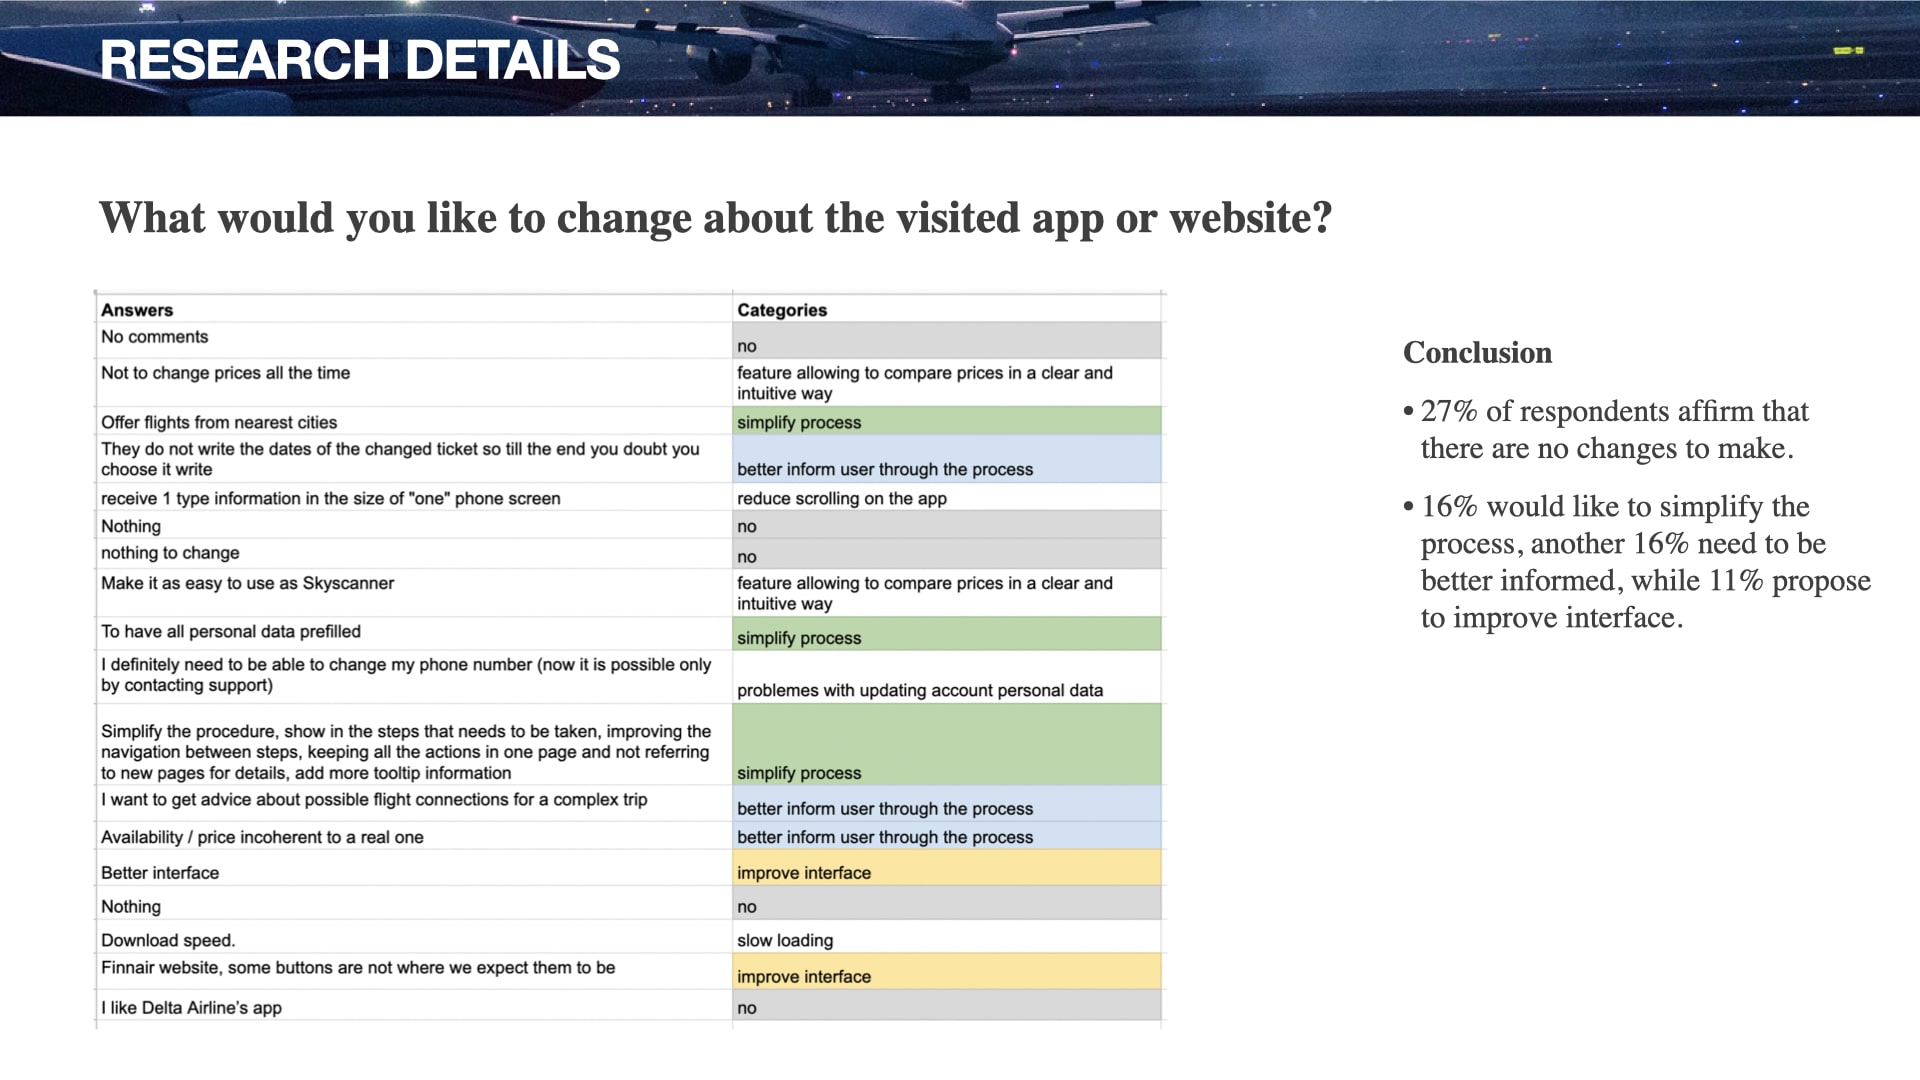
Survey
To learn more about the goals of the airline apps’ users and the factors preventing them from completing their tasks, I conducted a survey via Google Forms. In less than 24h I got 18 responses. 7 questions were asked (3 structured and 4 unstructured).
For this survey conducted as a part of my study project, I was not looking for a large sample. For a real-world project I would expect the sample group to be larger.
Problems
The survey revealed the following problems preventing users from completing tasks:
- Prices
- Slow loading
- Poor interface
- Difficulties to benefit from the frequent flyer program
- Luggage policy
- Personal doubts
Needed improvements
There were also needed improvements mentioned by the respondents :
- Simplifying the process (16%)
- Informing user in a better way (16%),
- Improving the interface (11%)
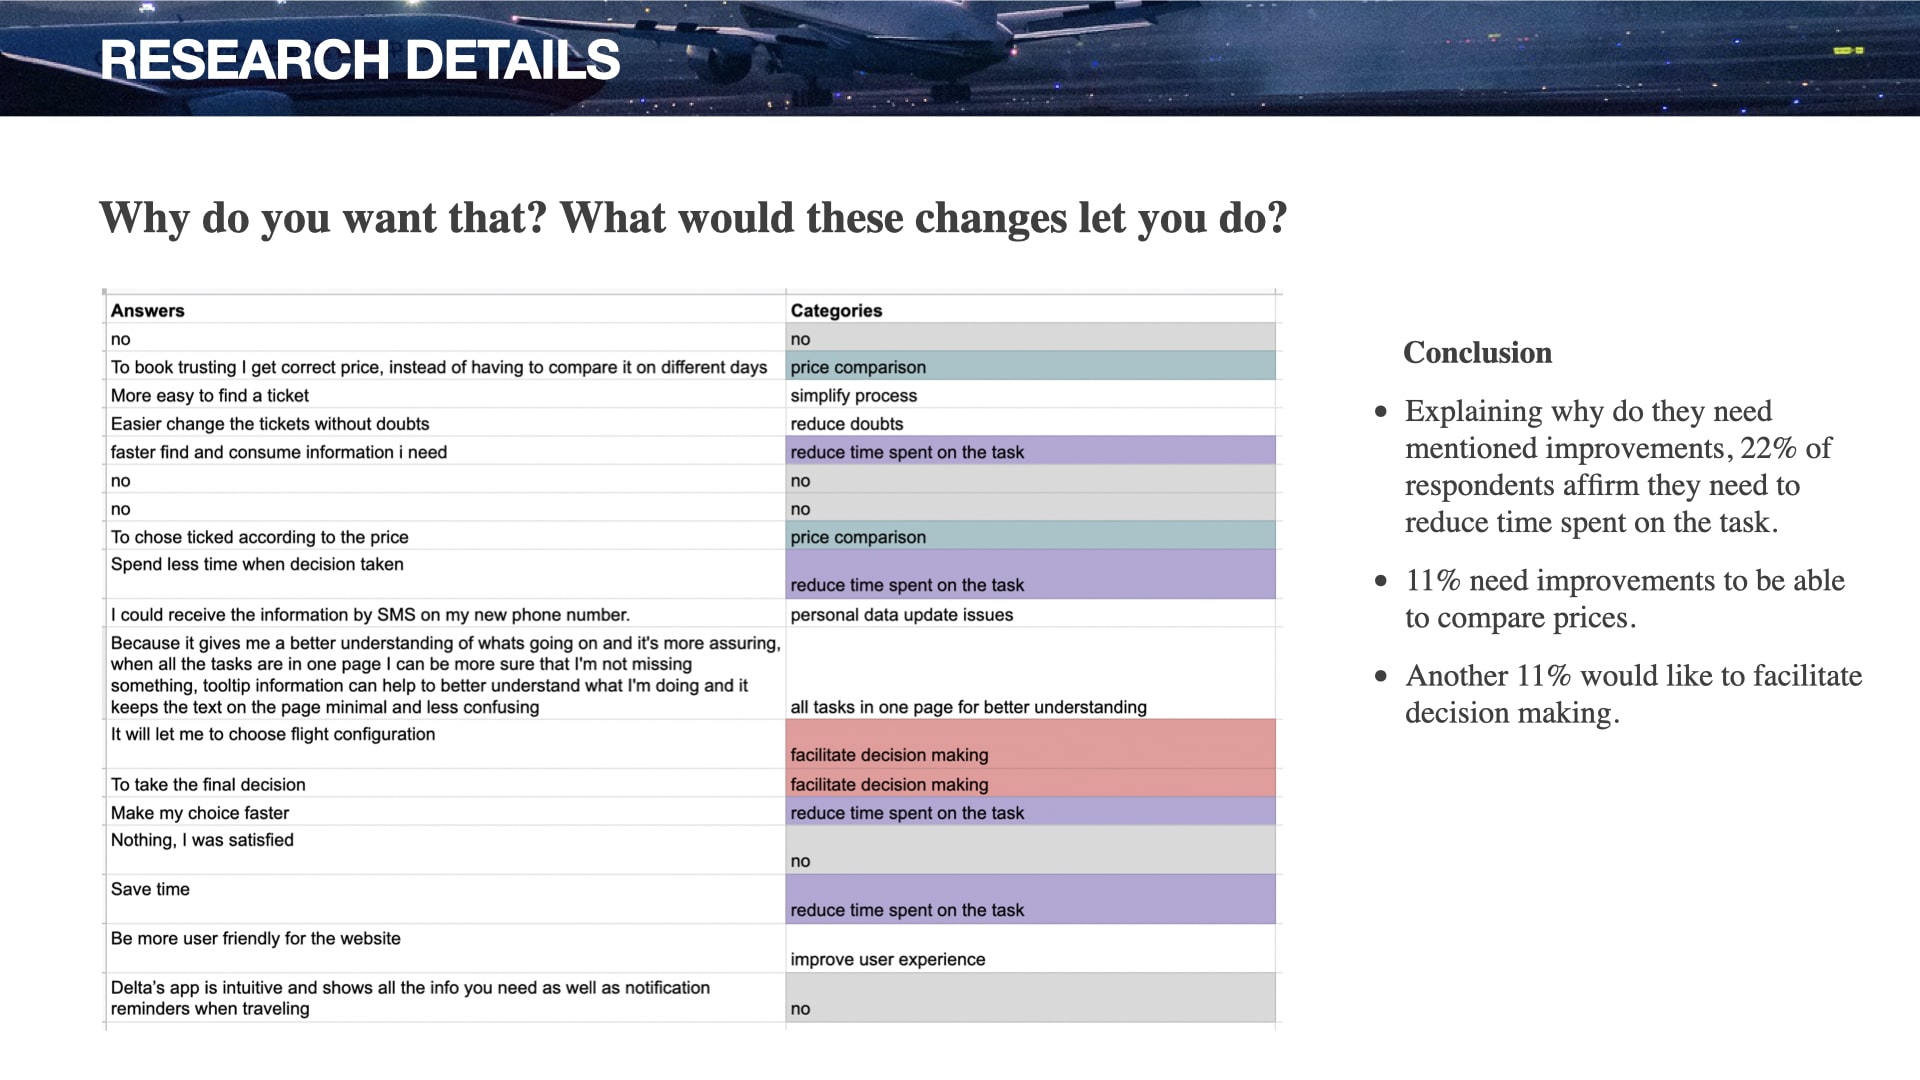
Desired result
The mentioned improvements would let the respondents:
- Reduce time spent on the task (22%)
- Be able to compare prices (11%)
- Facilitate decision making (11%).
Usability Tests
I couldn’t rely only on the benchmarking and survey data, and I wanted to identify the real user pain points and conventions through usability tests.
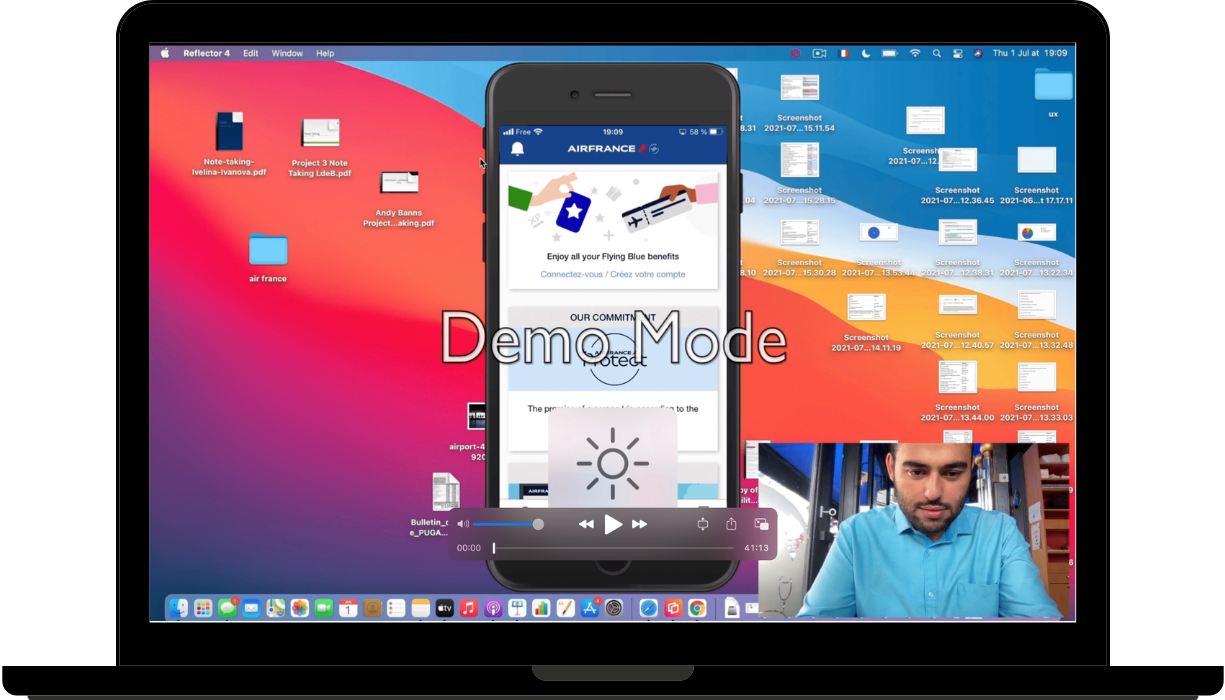
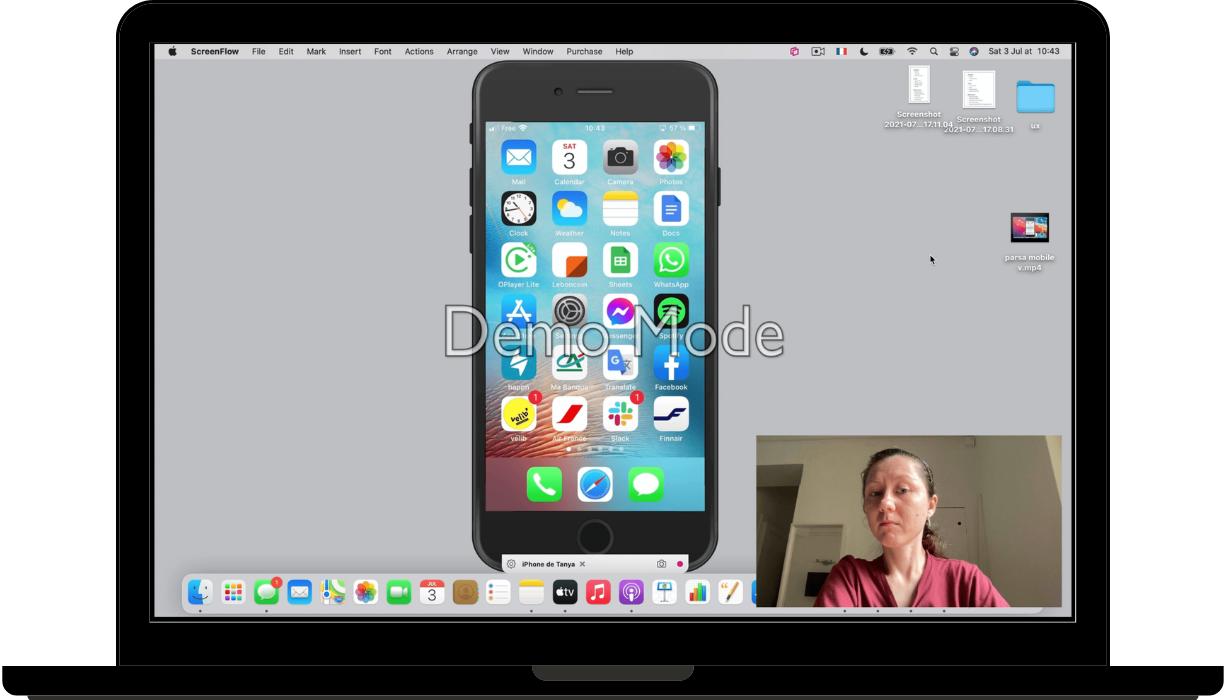
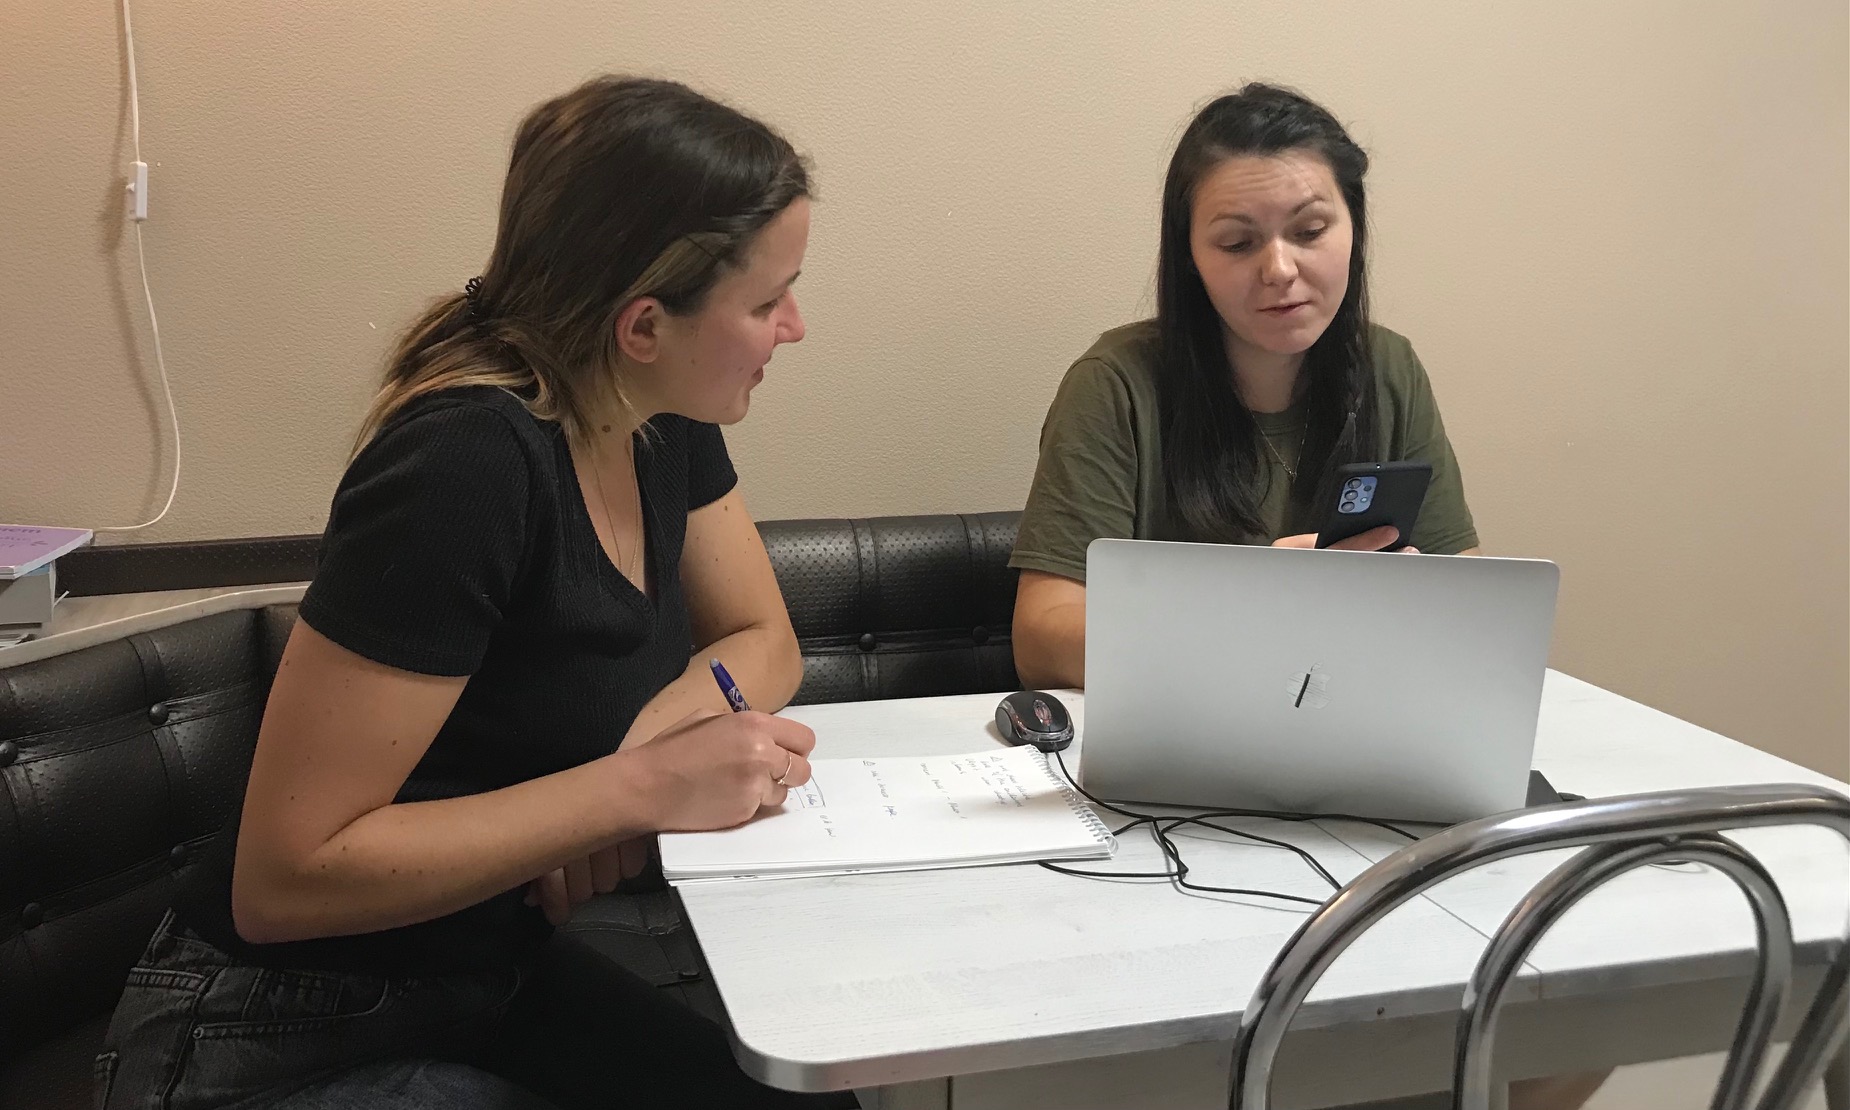
I conducted two usability tests for this project in order to physically observe how the users moved through the flight booking process, while mirroring their iPhone screens using Reflector and recorded the screens using ScreenFlow.
Despite the context of a pandemic, I managed to conduct in-person usability tests which allowed to observe and note physical, verbal, and emotional responses, which are challenging to access remotely.
For example, on of the users had a really unpleasant user experience with a passenger details page. It took her more than 15 minutes to validate the form, I could observe her stress and even a panic, see the real magnitude of the problem and realize how painful and frustrating a poorly designed form could be for a user.
During the both testsAfter a short interview to gain a better understanding of the context in which they would use a travel app, I then asked them to use both the Air France and Finnair apps. I finished the tests with further questions to gage their overall thoughts and experiences of the process.
Cick here to see the video with the 1st user
Cick here to see the video with the 2nd user
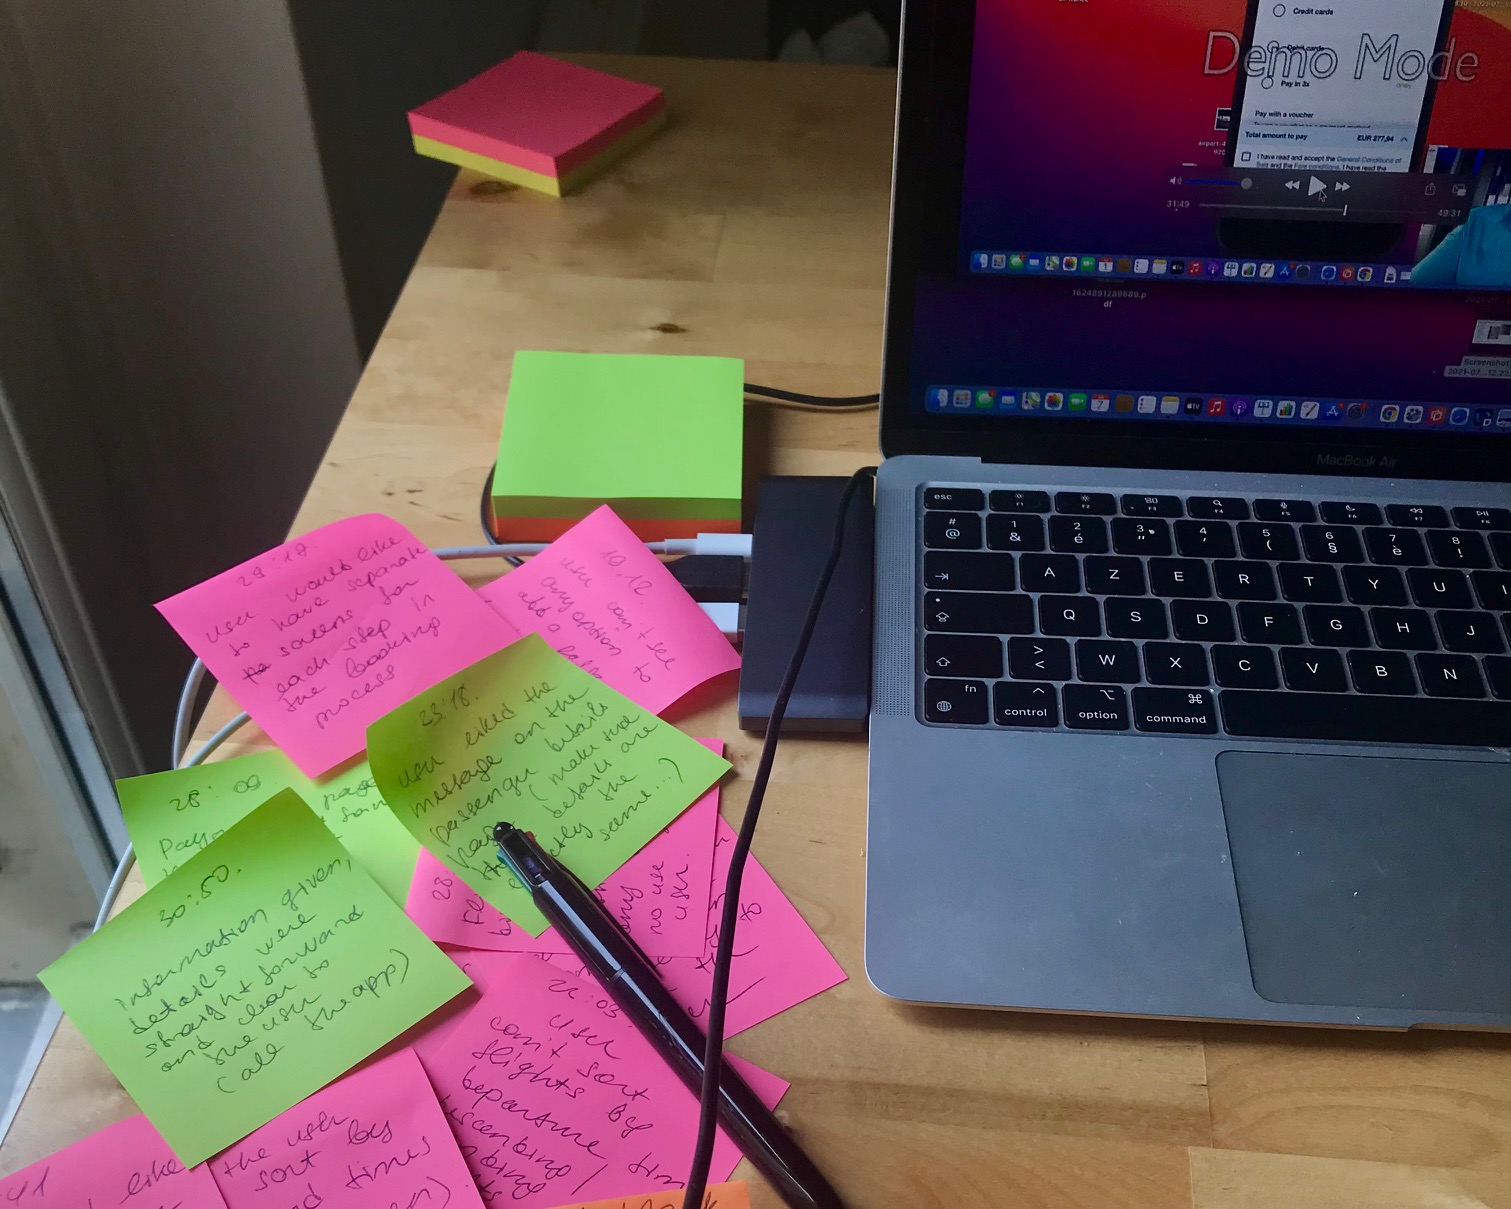
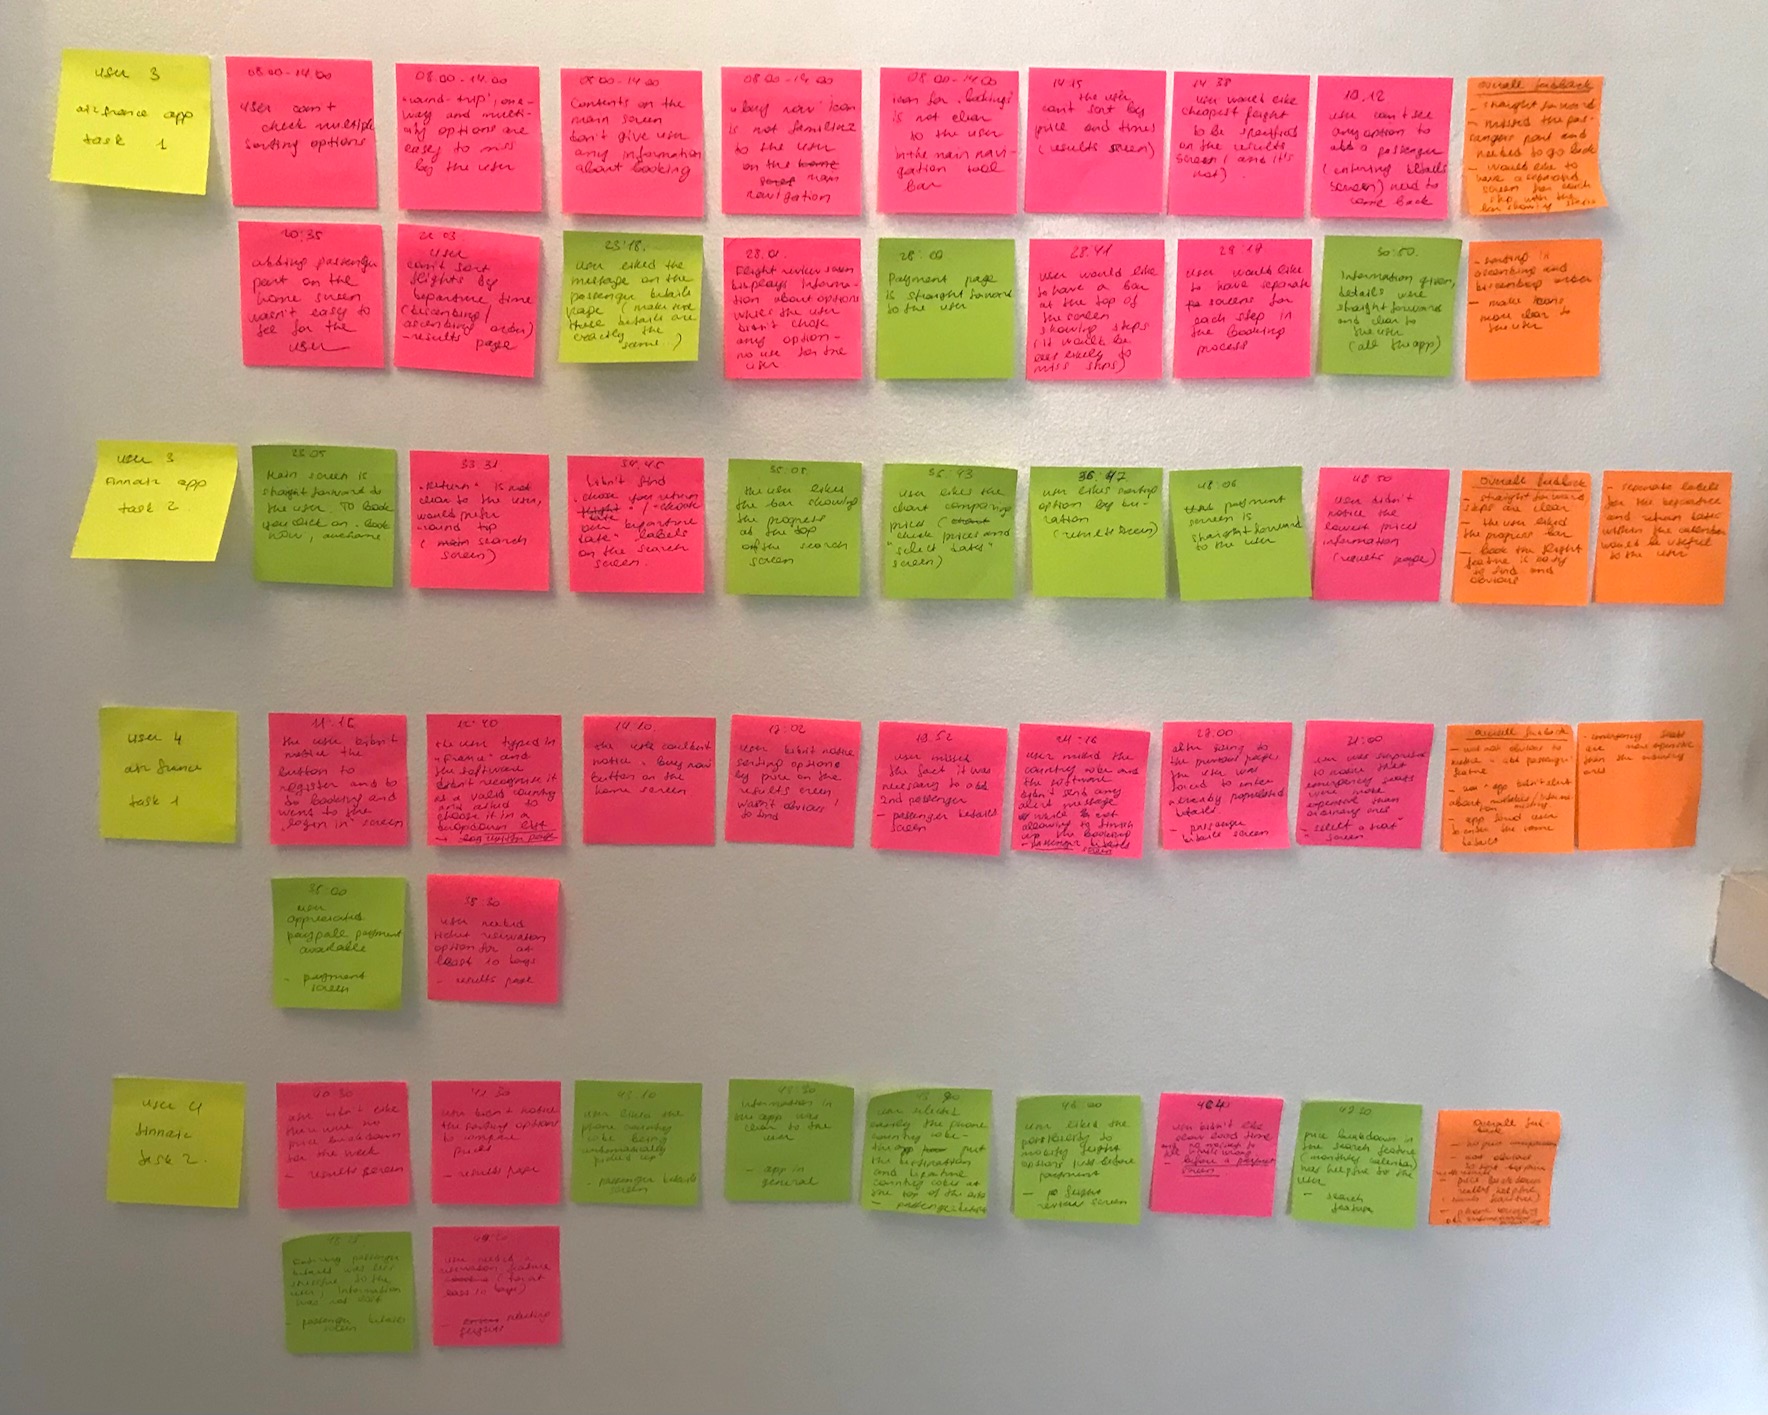
Note-taking
For a full picture of the positive interactions and pain points participants encountered during the flight booking process, I made detailed notes on the realised usability tests. I used colour-coded sticky notes to break down individual wordy elements according to the experiences of both users on the Air France and Finnair apps. My goal was to break down the data seen on the videos as clearly as possible.
Then I combined colour-coded post-notes of both users when they had similar or different negative or positive experiences with using an element. This feedback allowed me to clearly recognise commonly appreciated or disliked elements of the user experience while booking a flight.
Overall, both users had difficulties with finding the cheapest prices on both apps, being very price oriented.
Similar experiences
Air France
- Both users missed the “add passenger” feature and had to come back to the very beginning of the booking process to add a passenger
- The “buy now” icon was not clear to the both of the users
- Both users couldn’t find the lowest prices on the results page
Finnair
- Both users liked the possibility to have a monthly view of prices in the search feature
- Both users needed the lowest price information
Different experiences
Air France
- User 1 didn’t have any problem finding the booking feature, but was not happy the contents didn’t provide any information about booking; user 2 really struggled with finding how to register / access booking
- Entering passenger details was quite clear to the user 1, he had a positive interaction on this screen, while user 2 struggled for more than 5 minutes to enter her details
Finnair
- Overall users had a positive experience with the app, but they appreciated different elements
Analysis
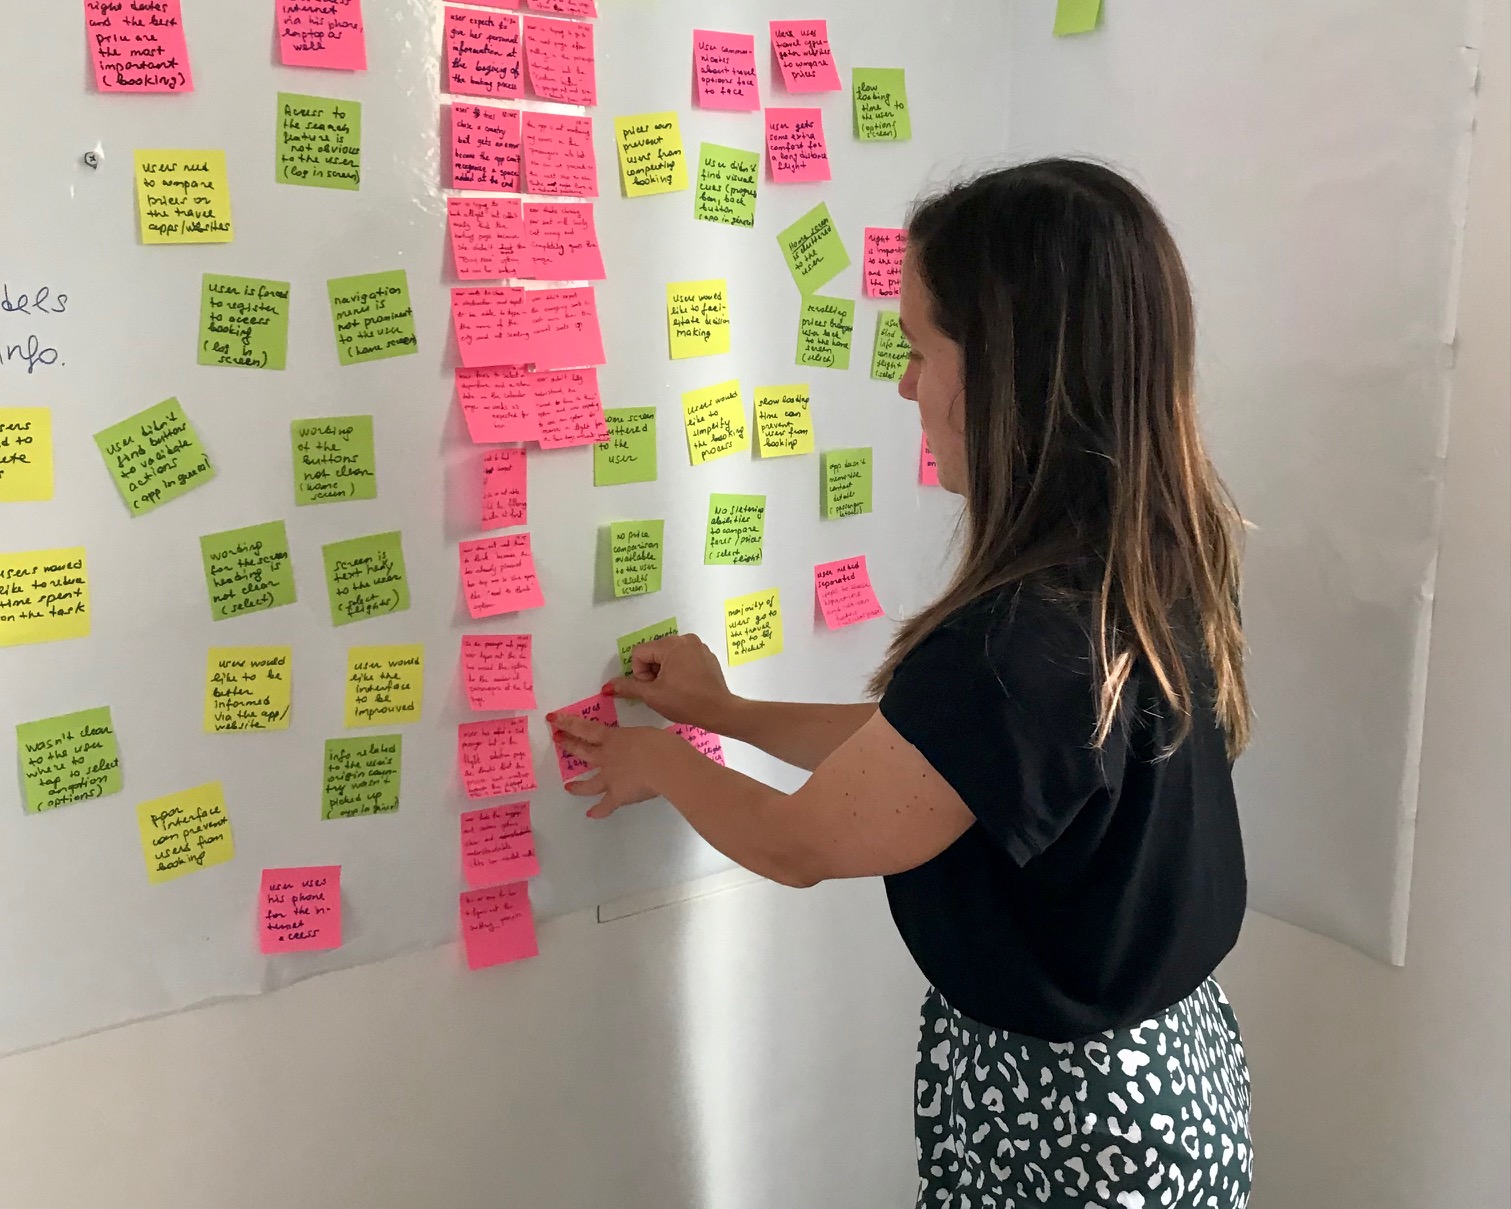
Affinity Diagram
To design an infinity diagram, I prepared a stock of sticky notes with the following colour-coding organised by a research type : pink notes for the usability testing data, the yellow ones for the survey data and the green notes for the benchmarking data. With a friend who worked with me on this project, we reviewed the recordings of the usability tests and other research data while making notes.
It took us more than 1 hour to prepare all the notes and to stick these to the whiteboard. As we organised the sticky notes into groups for about 1 hour, we could slowly see the groups emerging. In some cases, we took large groups and organised them into smaller subgroups after brainstorming to organize a large number of ideas into their natural relationships.
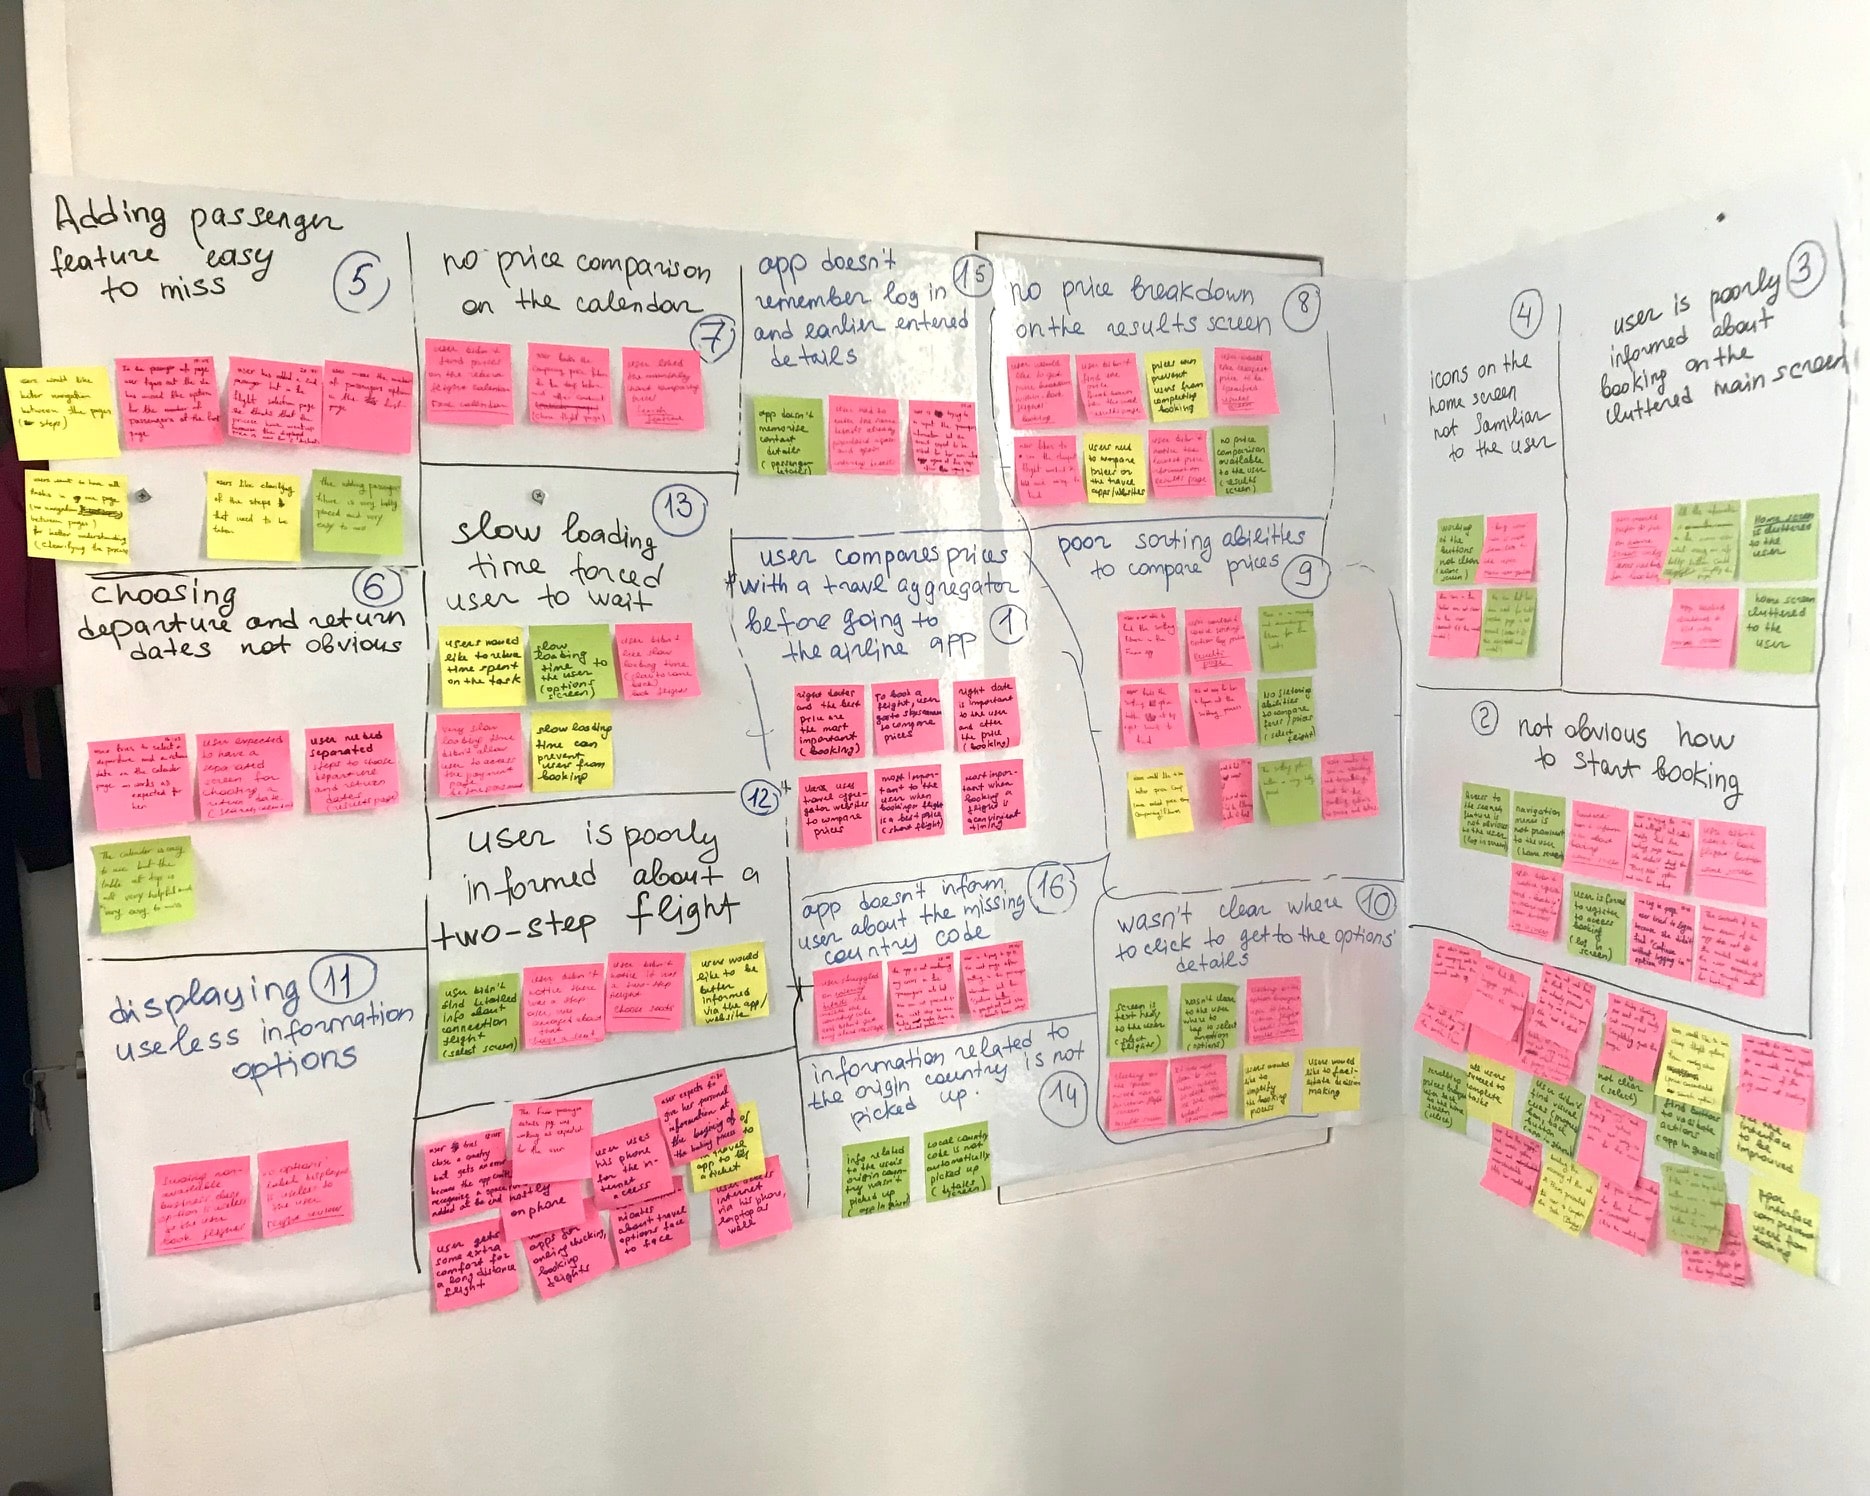
My friend proposed to organize notes by type of a user problem, and my initial idea was to group notes accordingly to the Customer Journey Map phases that I already had an idea of. Finally, after brainstorming we decided to reorganise the stickers by type of problem encountered by users, such as:
- Not obvious how to start booking
- User poorly informed about booking on the cluttered home screen
- Icons on the home screen not familiar to the user
- Adding passenger feature easy to miss
- Choosing departure and return dates not obvious
- No price comparison on the calendar
- No price breakdown on the results screen
- Poor sorting abilities to compare prices
- It wasn’t clear where to click to get to the options details
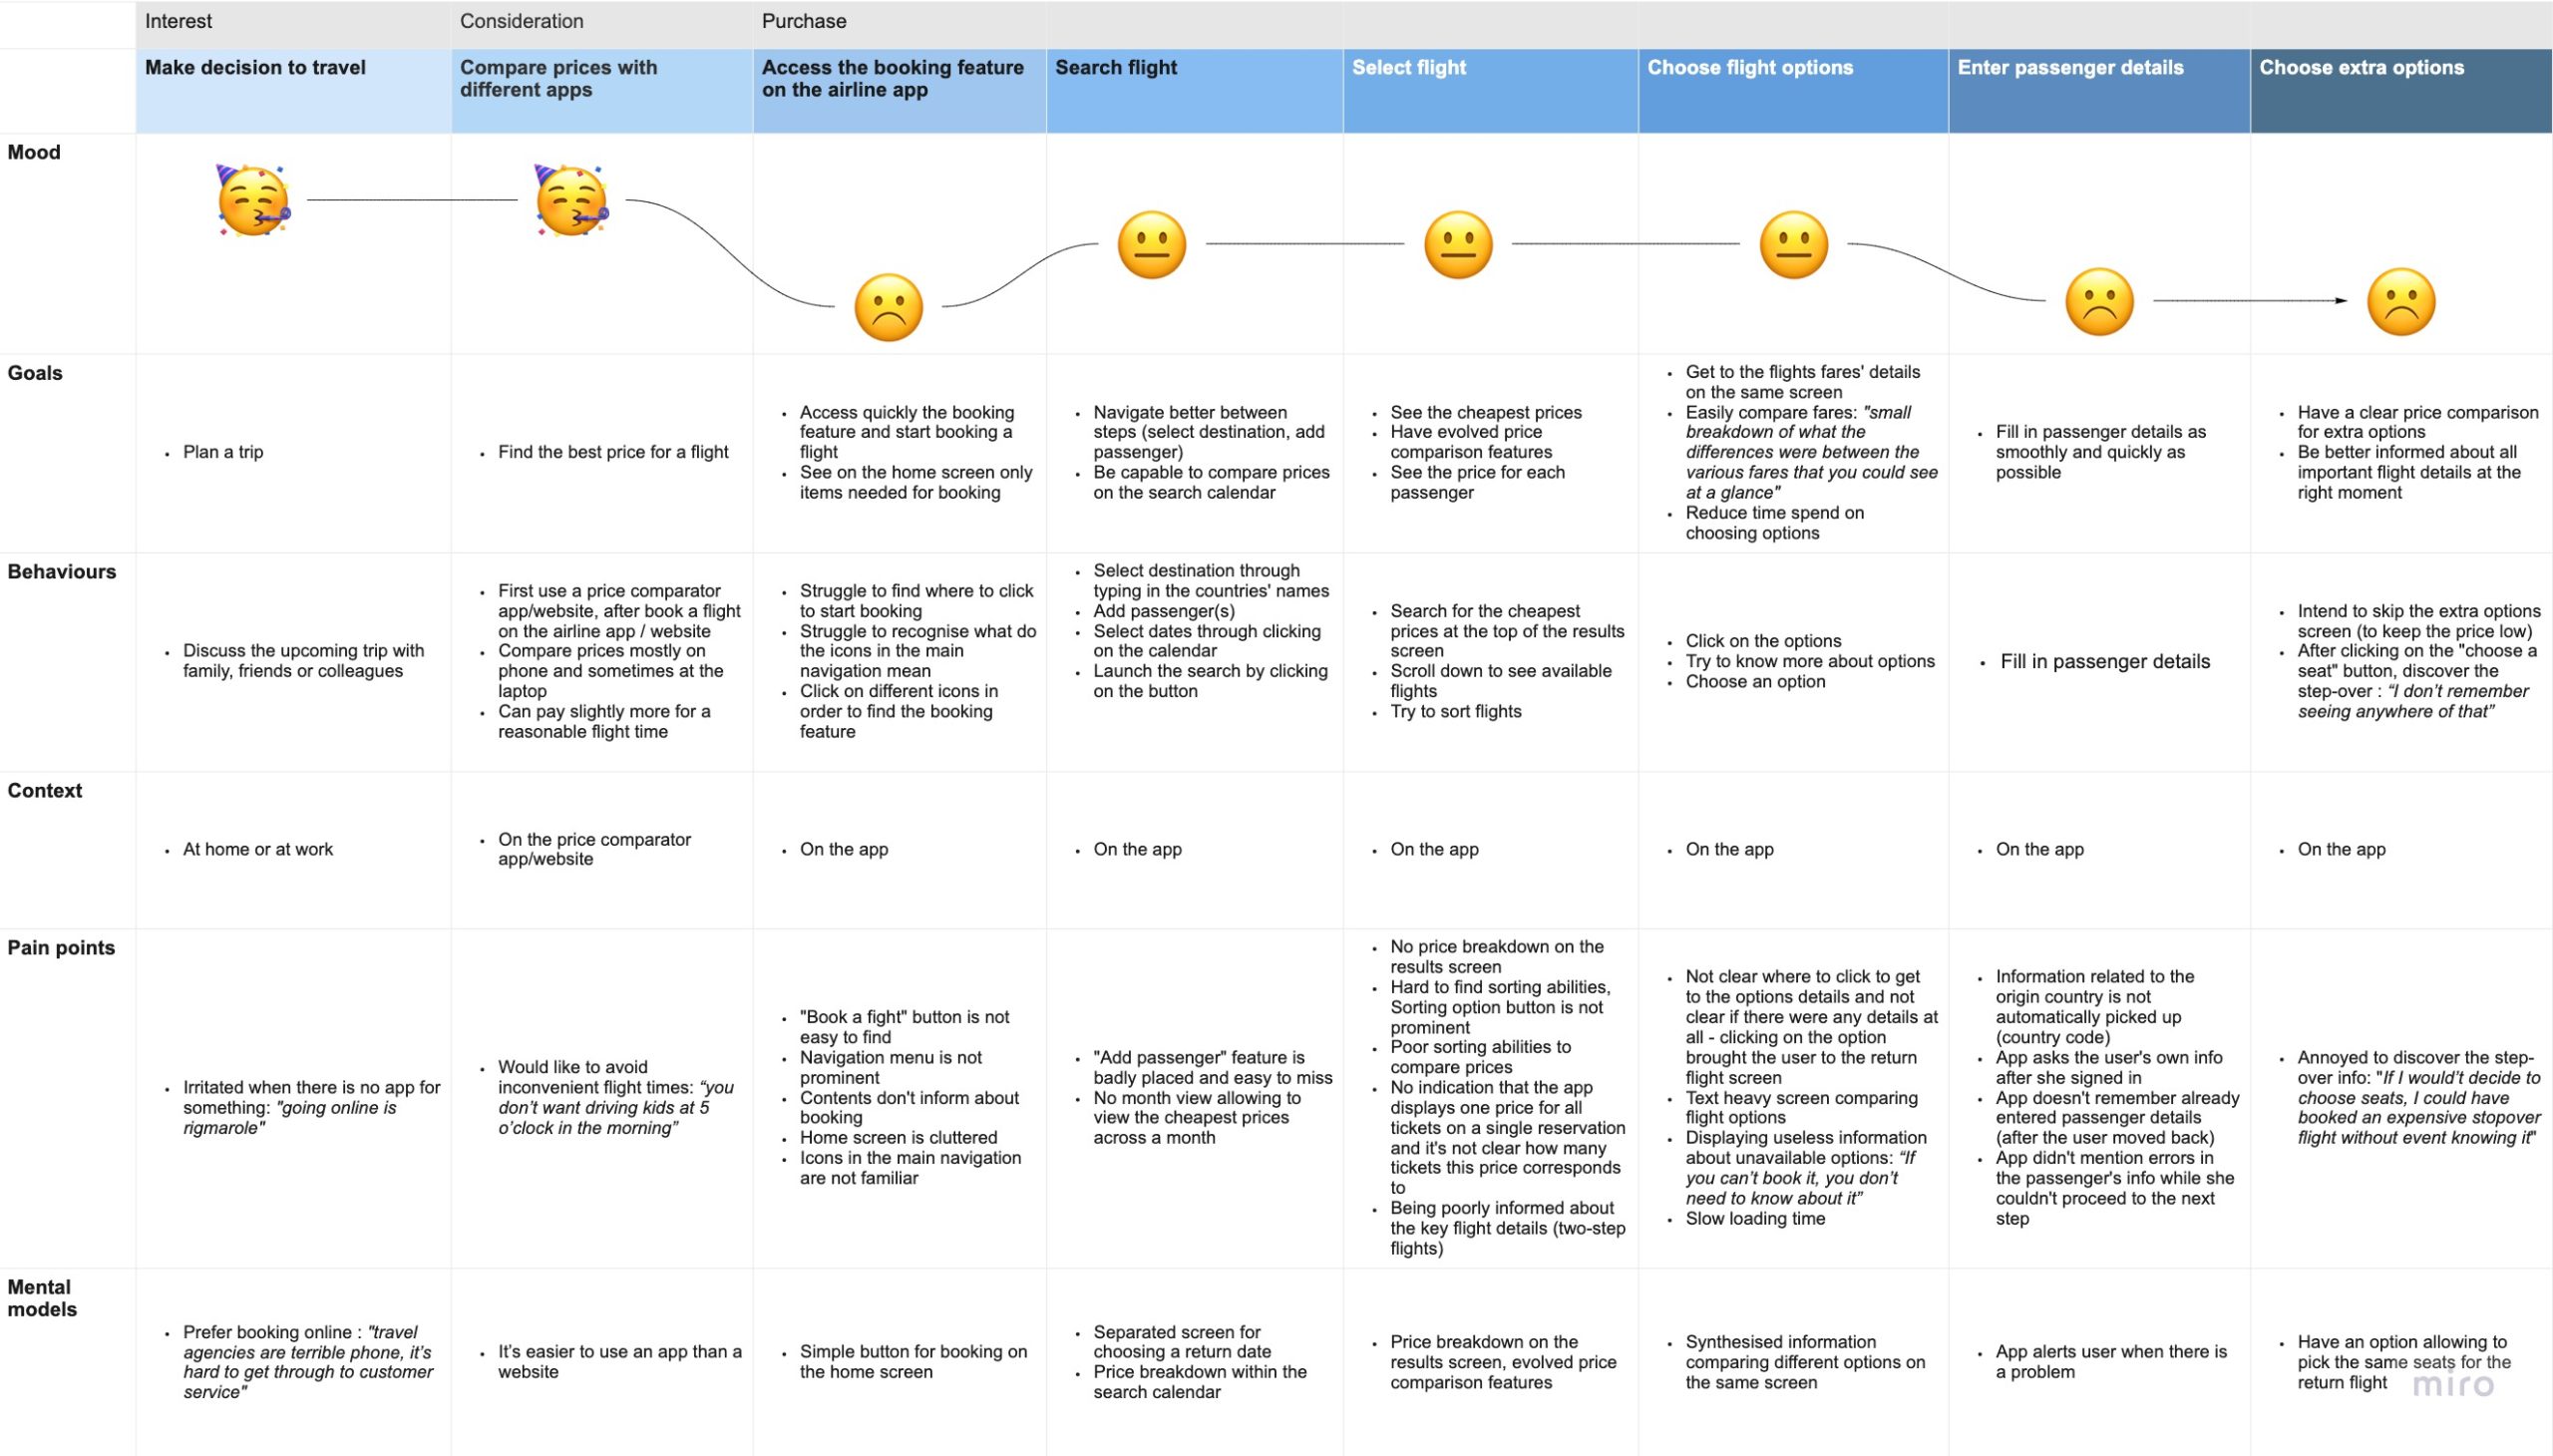
Customer Journey Map
I created a Customer Journey Map to obtain a clearer picture of the user’s goals, as well as the key areas in which they encountered the pain points.
From this it is clear that the majority of frustration encountered concentrated around hardly recognisable icons on the home screen, the poor sorting abilities and no price breakdown on the results screen, and the fact that contact details related to the origin country or localisation were not automatically picked up. Clearly, these elements of the flight booking had to be fixed which is something I kept in mind for my final design.
Among goals revealed during the design of the Customer Journey Map are the following :
- Access quickly the booking feature
- Navigate better between steps
- Easily see the cheapest prices
- Get to the flight fare details on the same screen, have a clear price comparison for extra options
- Fill in passenger details as smoothly as possible
Design
Flow Diagram
The next step was to define a high-level flow for my app, including every interaction and screen state for the whole booking process, from the landing page, through to payment, using the combined gathered data from my Affinity Diagram and Customer Journey Map. I focused on one primary use case or a happy path which refers to situations where the user is behaving as expected when using an app.
I started mapping the user flow to include all the interactions users should have on my app, as well as software states as a result of the user actions. My goal was to determine how I want users to navigate on the app and address all the issues encountered by the users.
After designing the first version of the user flow, I moved to the design phase. As I went along designing the sketches and the different components if the UI, I realised that I missed different elements in my flow.
For example, while creating the user flow, I didn’t think of the passenger class selection and how this class choice should be made. I several iterations I decided to leave 2 classes with the economy 1 being preselected. After clicking on the “search flights” button, a user can see flights results highlighted accordingly to the selected or preselected class.
Also, I missed the fact that a seat selection and a baggage selection should be designed for all the passengers of the flight. To fix this, I added tabs related to the 1st and the 2nd passenger enabling a seat and a baggage selection for each passenger separately for an outbound and an inbound flights.
I went back to the user flow many times, made changes, and then went back to the sketches. I went back and forth many times between the flow and the screens to make sure my flow includes all the needed actions taken by the user and all the related software states.

Sketches
The next step in the design process was to physically sketch out the screens and screen states, including the features I wanted to include. Sketching allowed me to explore and refine my ideas.
I draw all the important details, so when it came to creating my prototype later I already had a clear idea of how I wanted the app to look and behave.
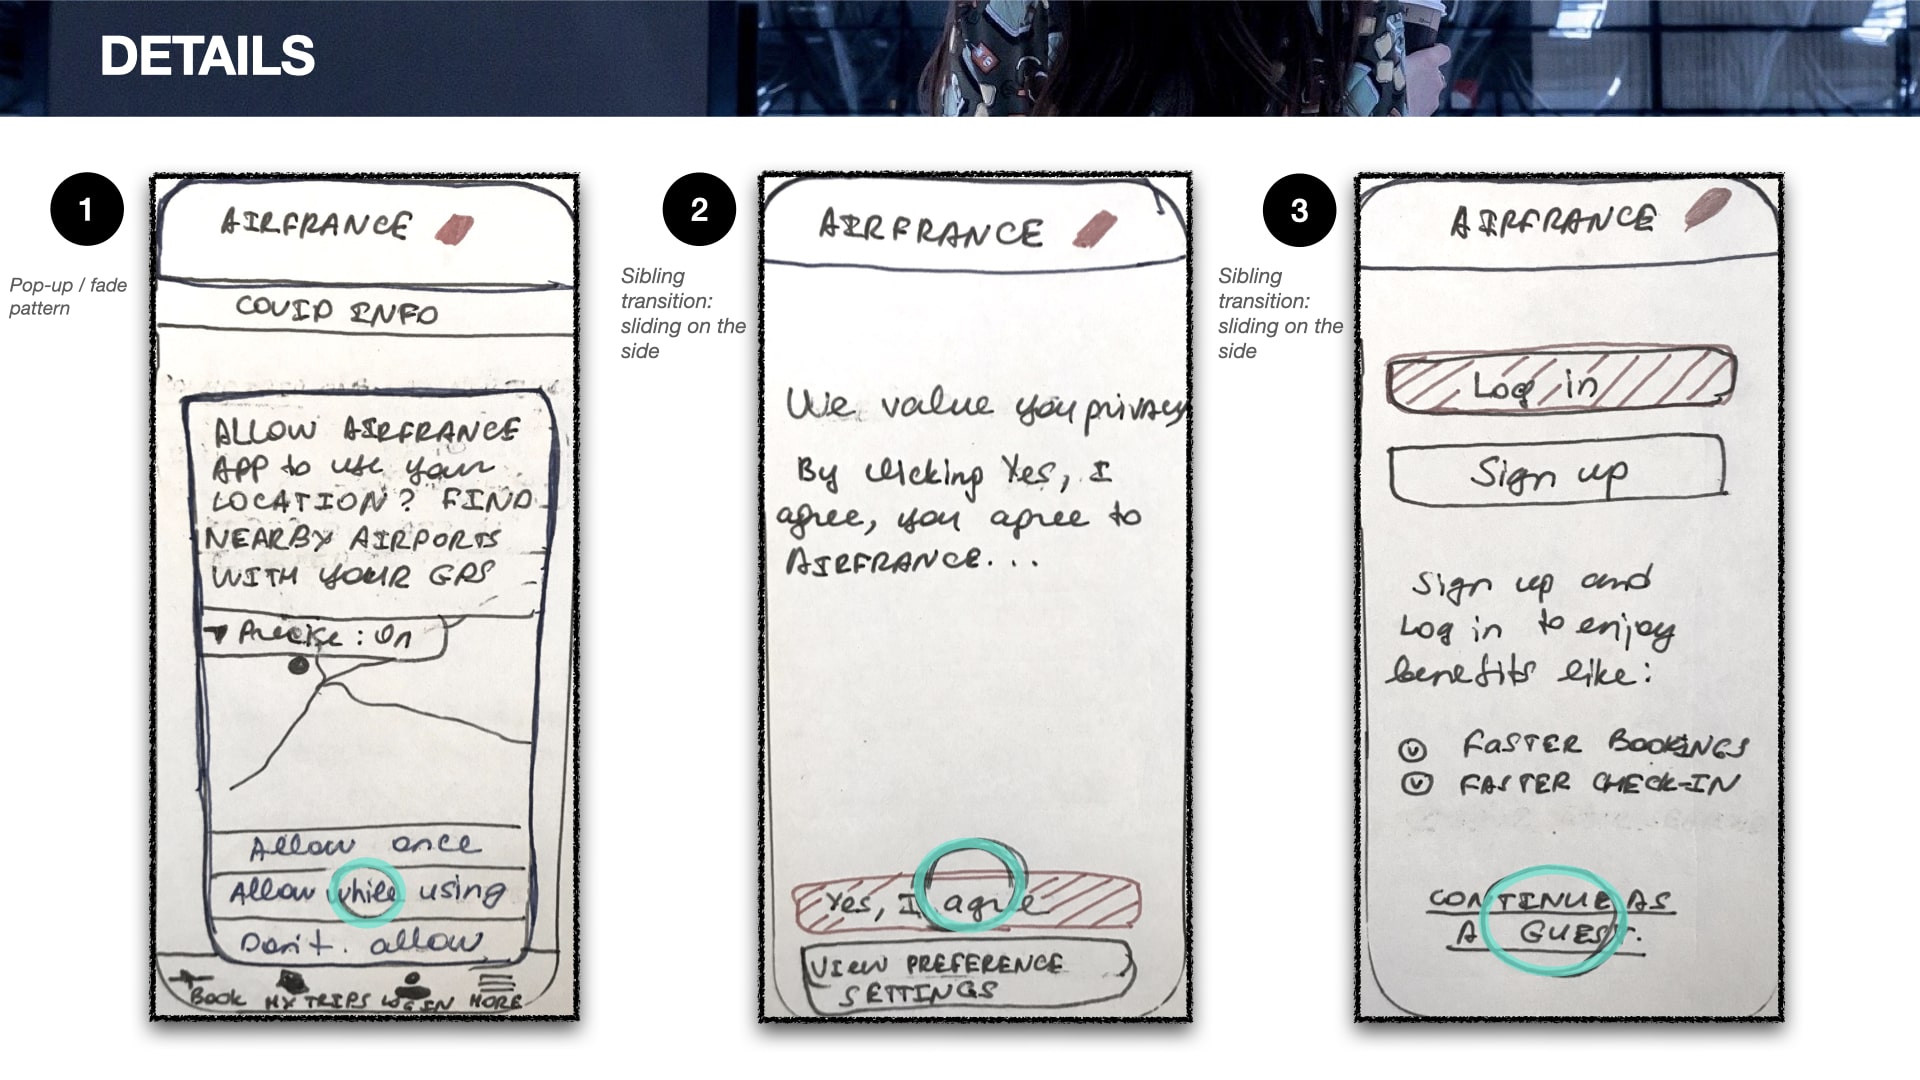
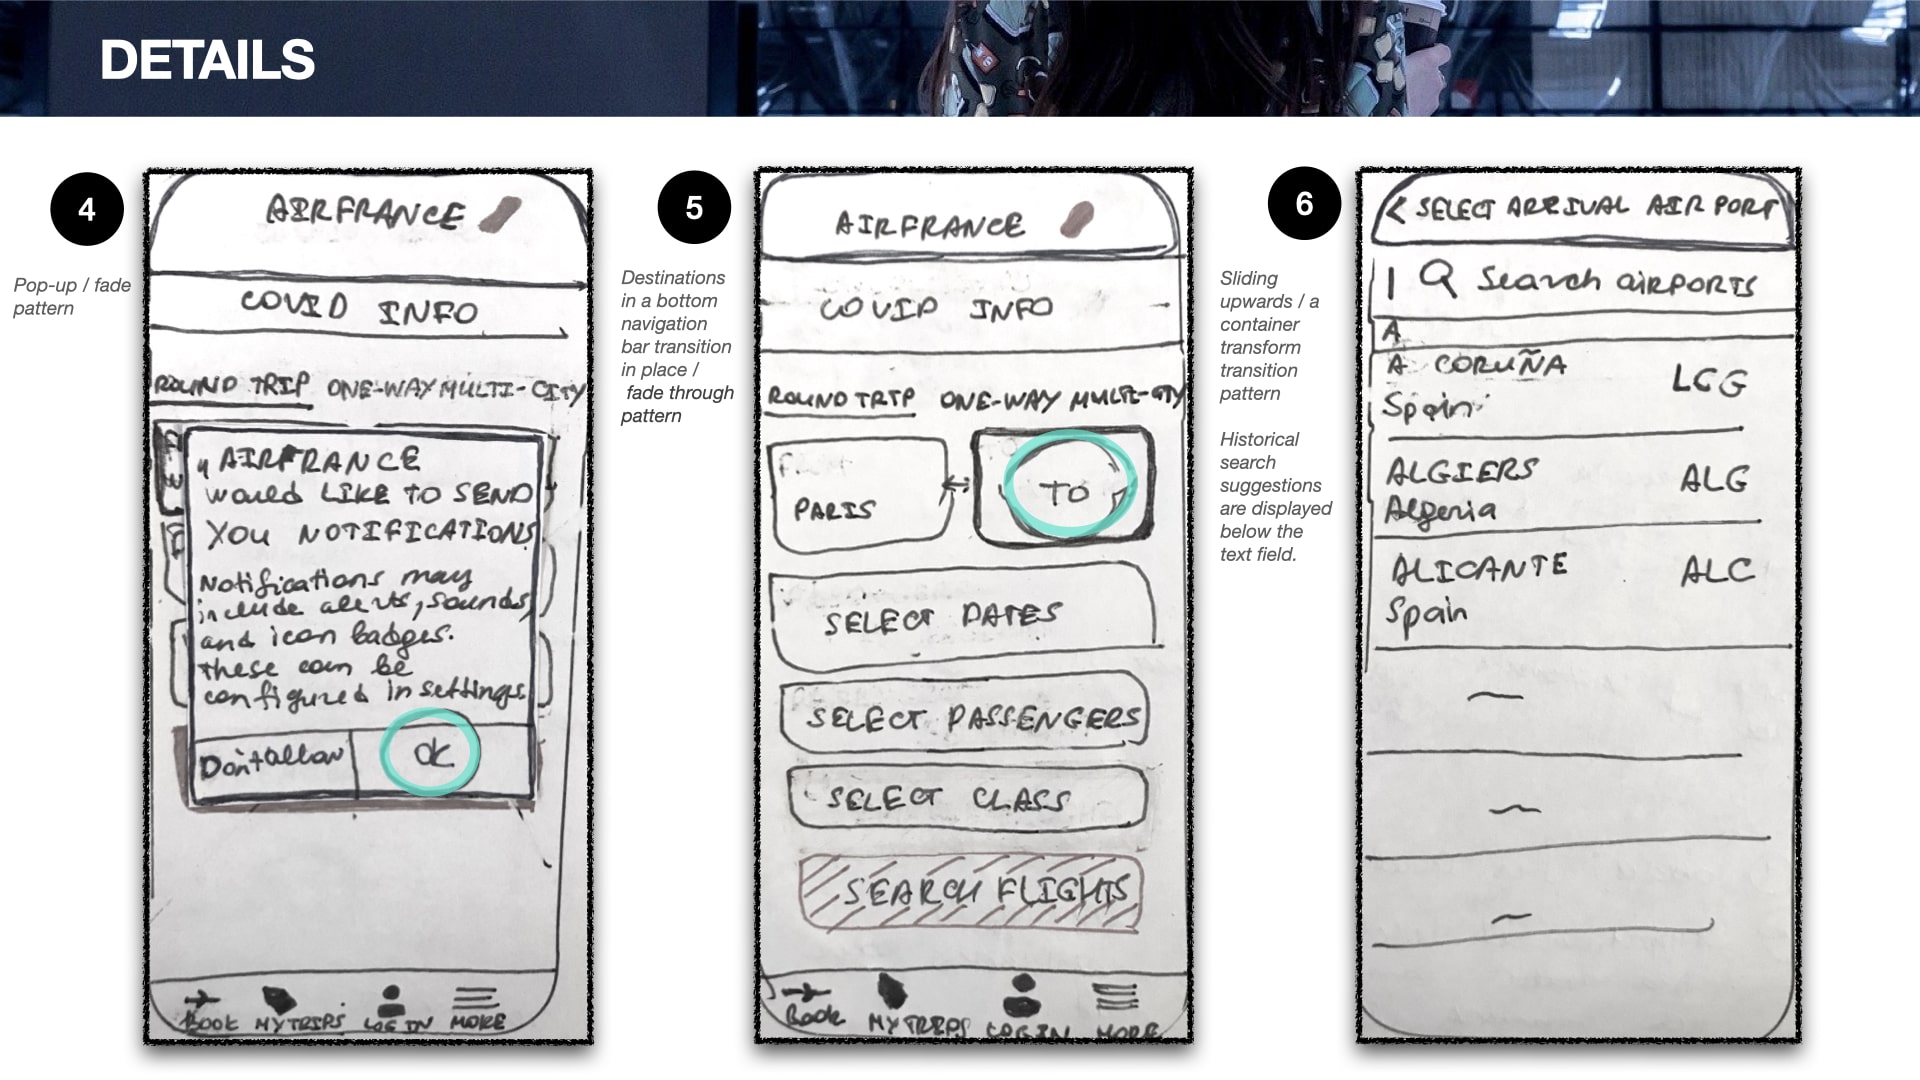
Findings
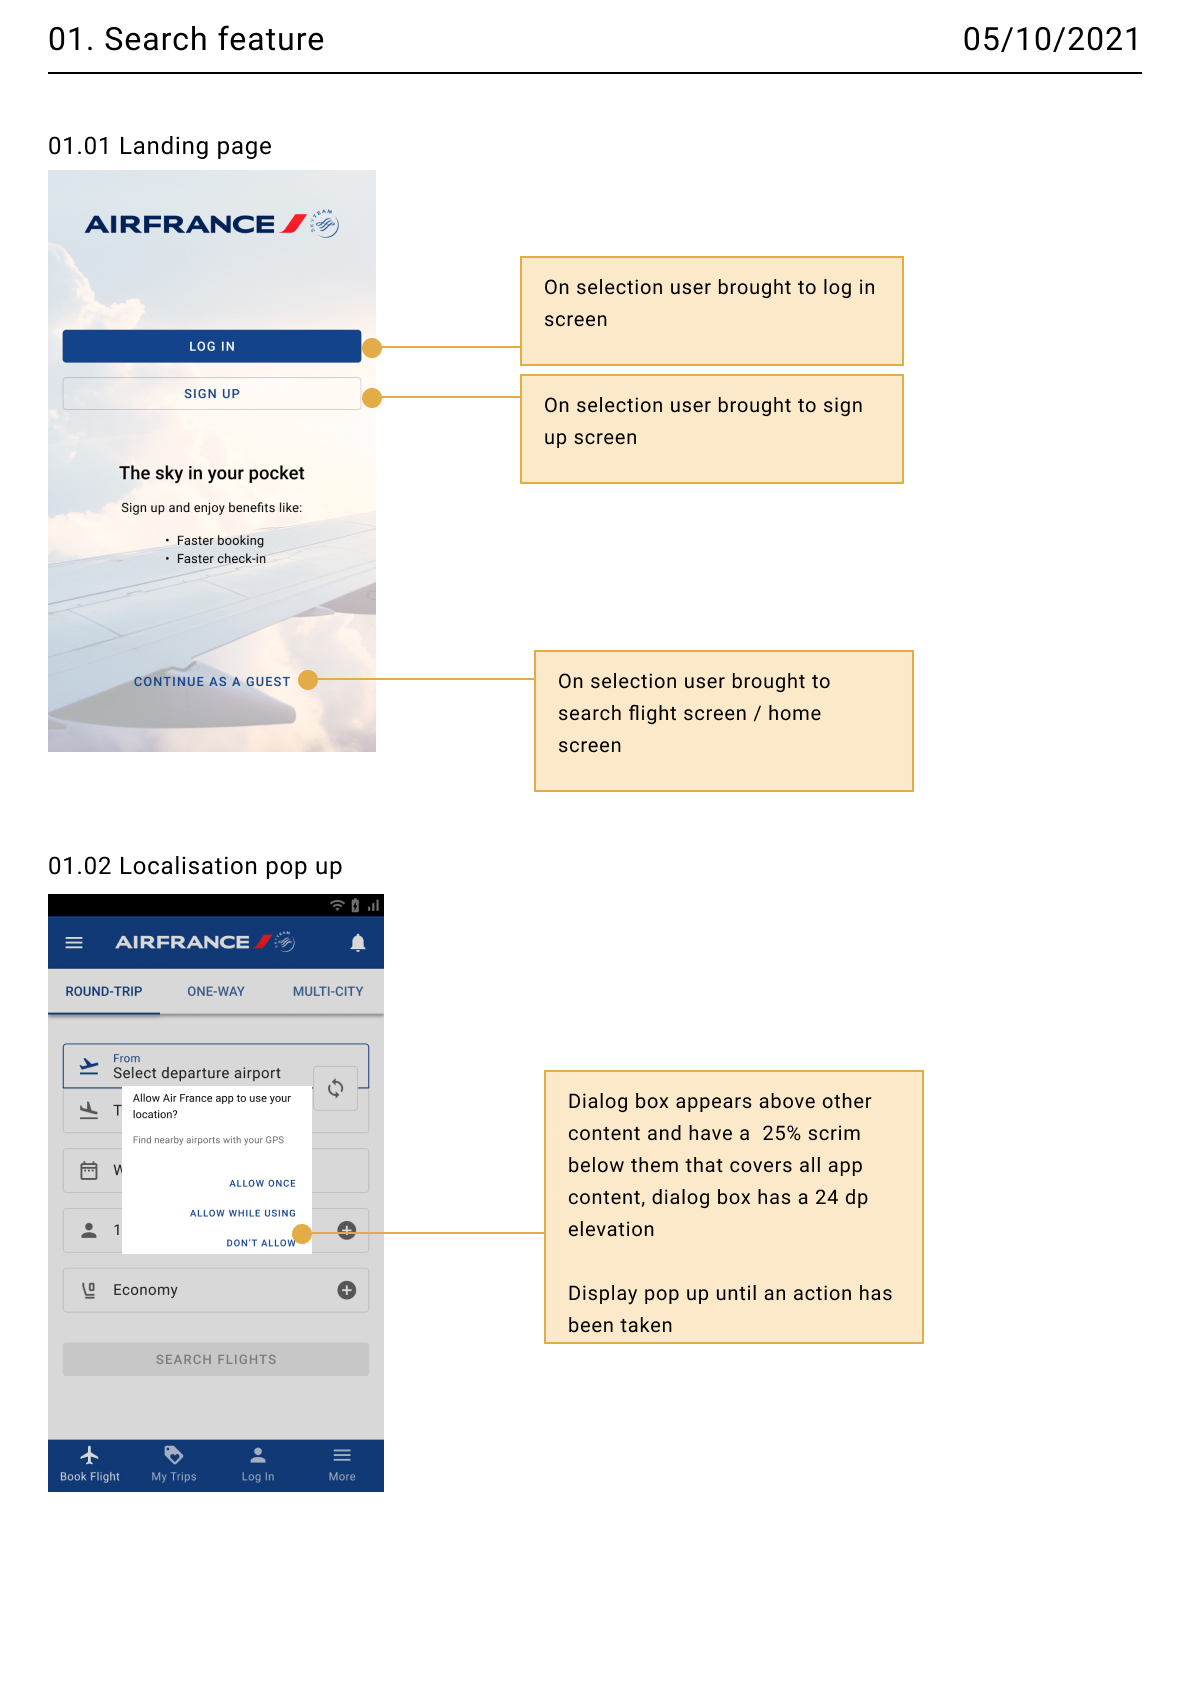
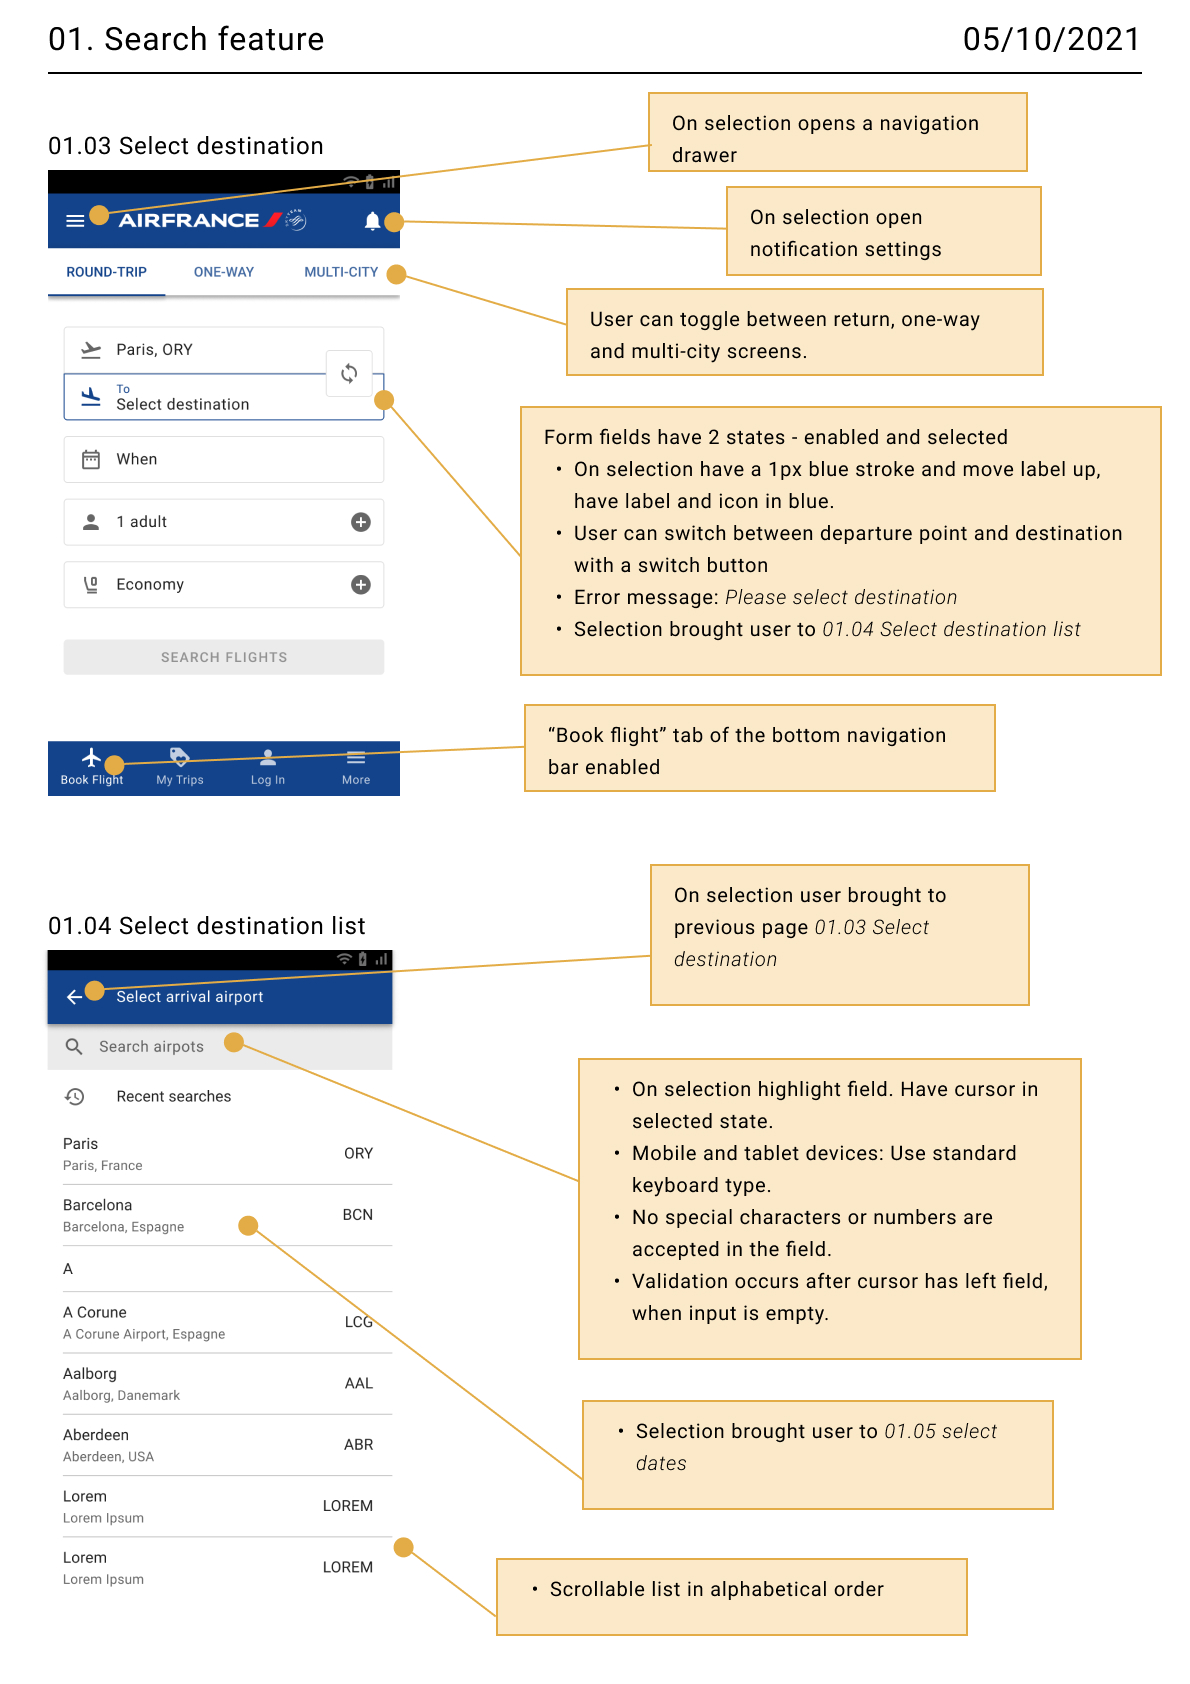
Search feature: after several rounds of sketching, I reviewed the order of elements by putting a date field right after a destination field. As an “add passenger” field was missed by the both uses during usability tests, I put this after a date field on a new line to make it more prominent.
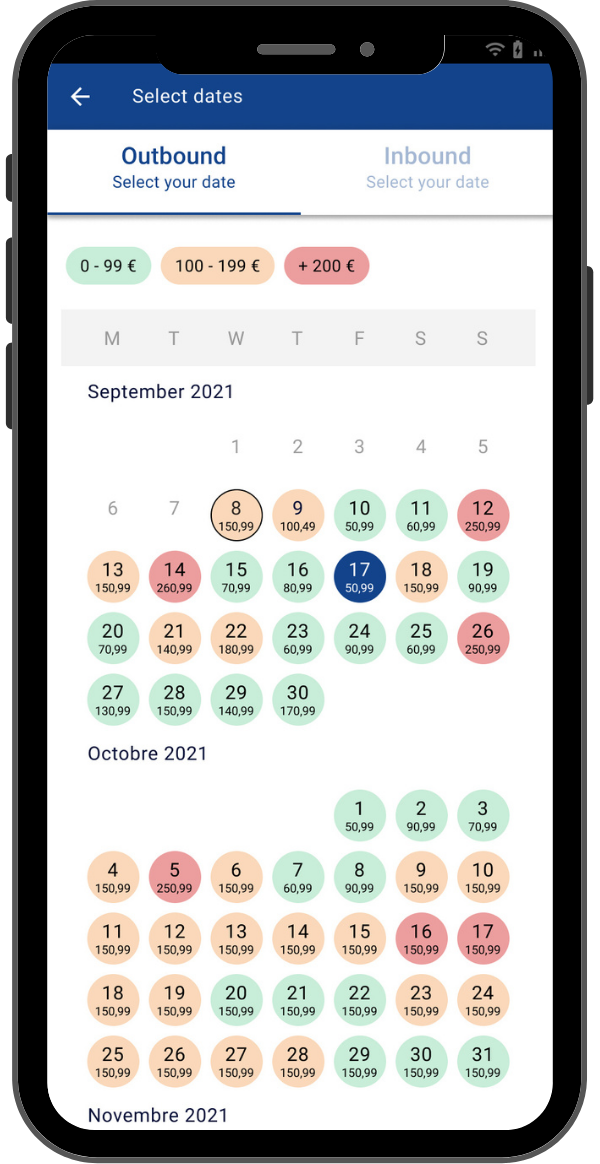
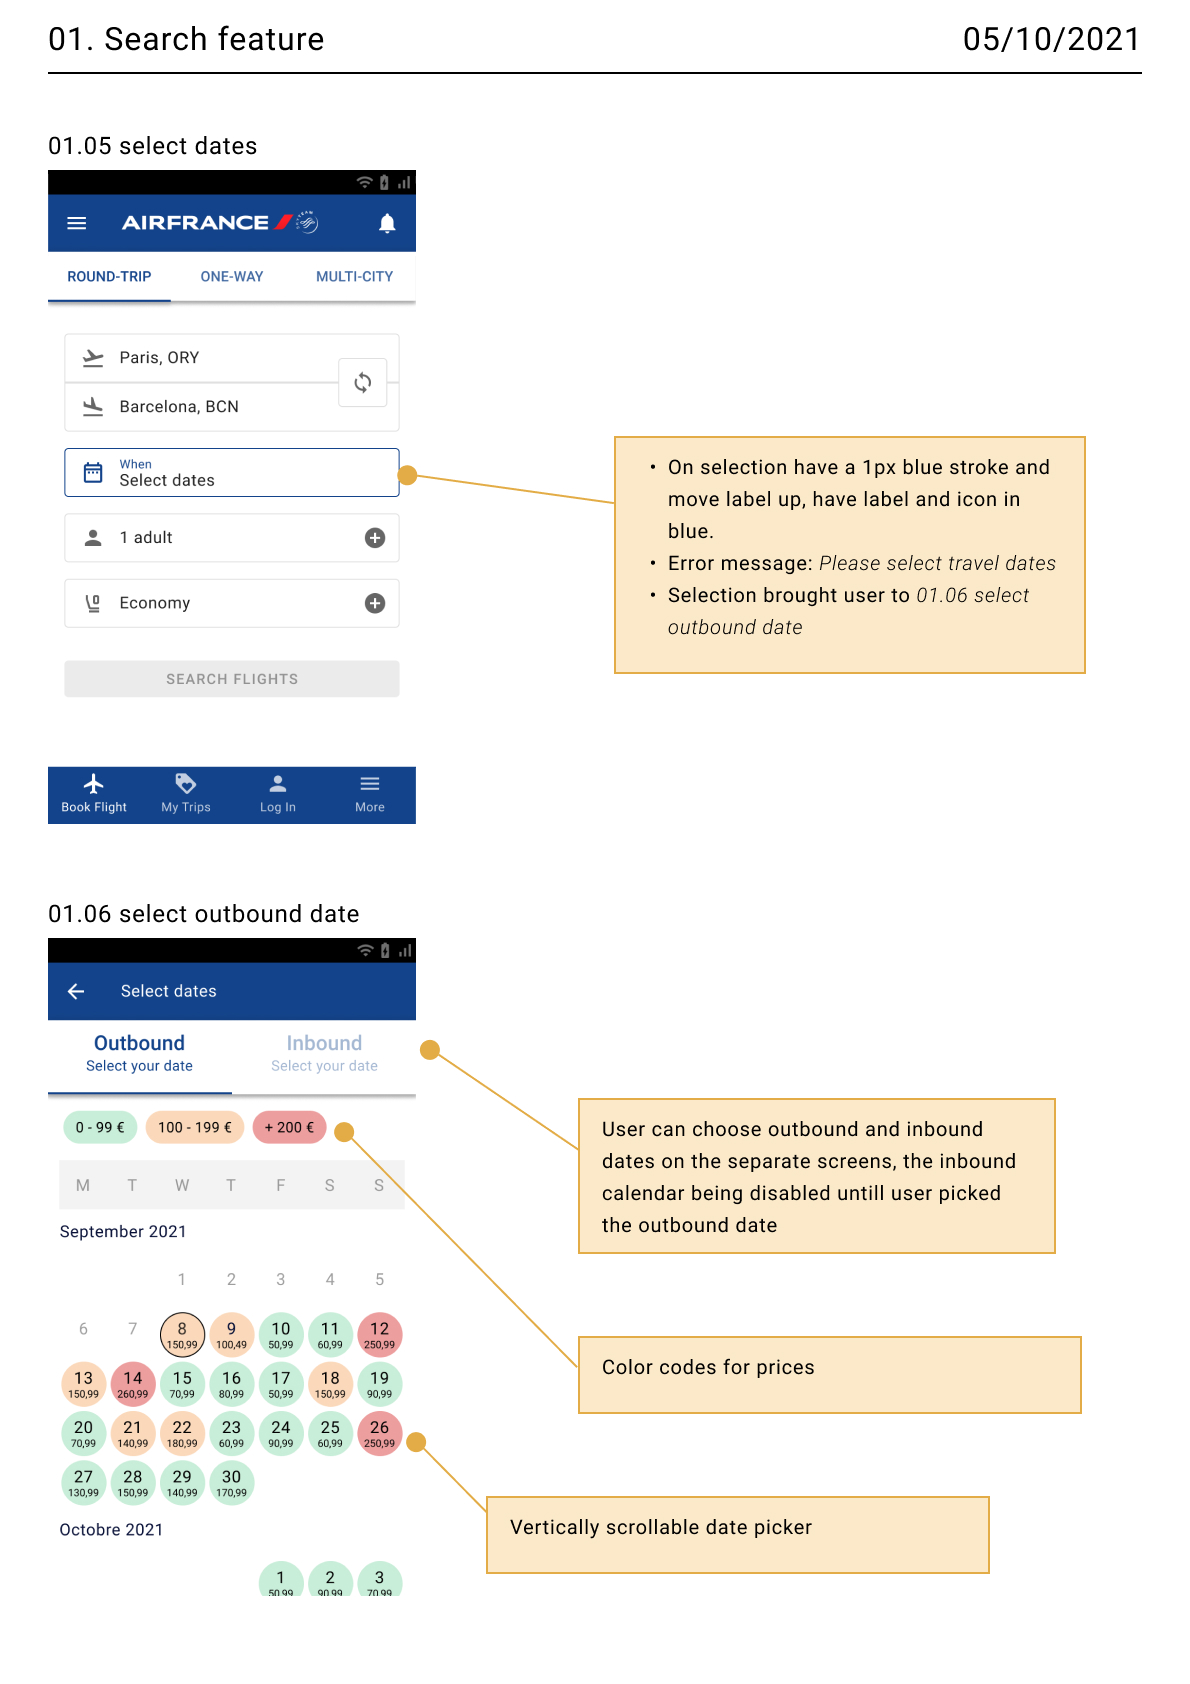
Calendar: taking into account issues revealed during research, my goal was to design an intuitive mobile date range picker and separate a selection of an outbound and inbound dates.
Add Passenger: I also reviewed passenger options estimated as contradictory during the research. I added the following options: adults, children, babies.
Travel Class: I optimised the travel class options by removing more “marketing” labels and putting “economy” and “business” instead, these too being commonly used and easier interpreted by users.
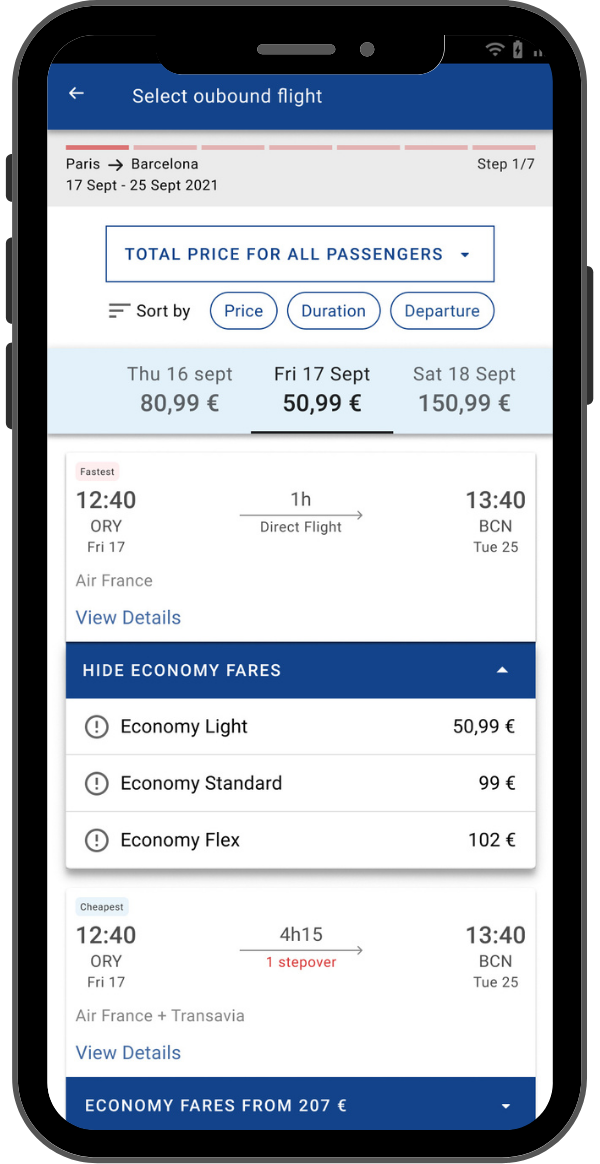
Search Results: while designing this screen, I kept in mind the issues highlighted during research. I added a progress bar at the top of the screen. The sorting abilities, that were on the top of the screen, have been moved above the search results breakdown. I replaced a single sorting button with 3 sorting options: “lowest price”, “shortest duration” and “earliest departure”.
Flight Fares: I decided to organise flight fares into 2 groups based on classes : economy and business. If a user selects “economy” before launching the search, he will see the “economy” option highlighted on the search results screen, alongside with the “business” one. Inversely, if a user selects “business” on the search screen, he will see the related option highlighted, the “economy” one also being available. Tapping on the desired option brings a user to the fare details with a possibility to get to the “fare details” screen or the “compares fares” screen.
Enter the passenger details: I organised passenger details in tabs: after completing the details of the 1st passenger, a user taps on the “continue” button which brings him to the next passenger tab. I also structured forms as a conversation explaining users why contact details such as an email and a phone number are requested.
Prototype
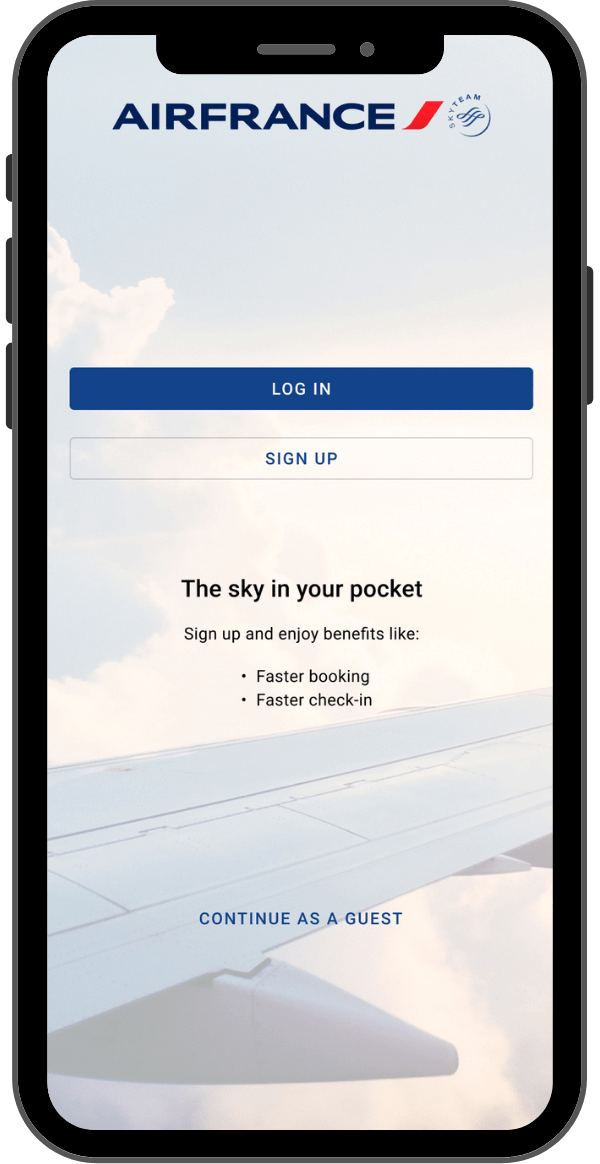
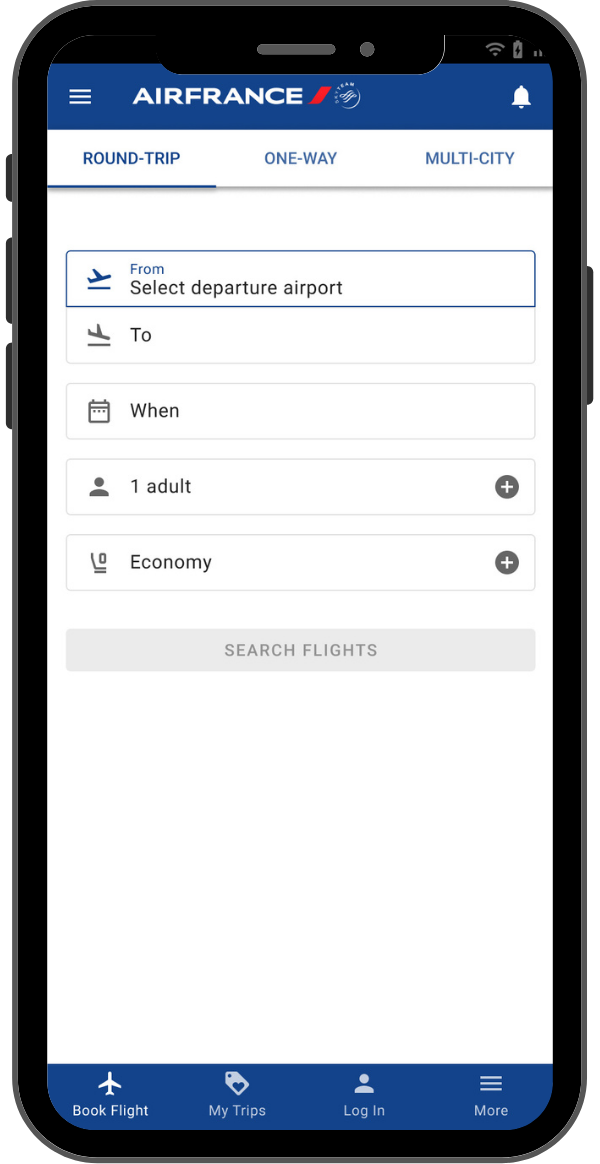
Medium Fidelity Prototype
After everything was done on the paper, I start drawing the screens in Figma. I used to work with Adobe XD Design, so I took me quite a while to handle a new design tool.
Figma provides a lot more creative freedom than paper and I could easily shift attention to minor things.
- I added states (enabled/focused) to the input fields of the search feature and put each of these in a separate line to avoid users missing any important step (as it was the case for “the add passenger” option during usability tests)
- I designed a colour-coded price-breakdown for the search calendar making it easy to choose a date with the best fares
- I put the sorting abilities right above the search results and made sorting available via 3 prominent buttons
- I included a progress bar at the top of the page, indicating to the users at which stage they were at in the seven step process.
- I included an option to skip class, baggage, seat and extra option selection to make the booking process quicker
- I highlighted the flight fares with stopovers so users could easily recognise these flights
- I included buttons to indicate on sections that could be modified easily without the user having to retrace their steps (on the “Flight Review” screen)
- I included a “total for all passengers” button to let user see how many passengers the displayed price refers to
- Throughout the booking process, users can see at the bottom of the page a fixed card with a total price and a button allowing to view the pricing details
- I included a “see seats details” button so that users can easily learn about seat fares
Validate
Usability tests of the prototype
Once medium fidelity prototype was ready, I ran a usability test with a friend who gave me valuable positive and negative feedbacks.
She appreciated the colour-coded price breakdown on the calendar. However, I didn’t mention on the calendar how many passengers the displayed price referred to, so she was disappointed once arrived on the search results page as the prices were not as expected. So I included the following label below the calendar : “Fares for this trip start from <…> € per person”.
On the search results screen, as on the search calendar, it was not clear how many passengers the displayed price referred to. I fixed this by adding a prominent button indicating the number of passengers included in the total price and also allowing to see the price per passenger.
After receiving the following feedback – “The first time I can see the total price is on the flight review page” – I added a prominent card fixed on the bottom of the page when scrolling. This card enables the user to see the total price and to view the pricing details.
On the seat selection screen, it was not clear which fare each seat option referred to. To fix this I included a prominent button “see seats details”. On selection the user is brought to a dedicated screen explaining seats’ fare details.
Delivery
Design annotations
Once I had created my medium fidelity prototype and tested this, it was time to create my design annotations. I created these in Figma and was careful to include as much detail as possible to make life easier for the developers.
Conclusion
Things that went well
- I am confident that the Airline app works well. The users I tested it on found the information they wanted with ease, and they flowed through the app quickly.
- I kept the price breakdown prominent and consistent throughout the whole process, breaking it down per person as well as a whole on the search results pages, resolving a pain point that had been highlighted in my usability testing.
- Contact details related to the localisation data as well as to the origin country (departure city, country code) are automatically populated on my app, again a problem flagged in my research.
- The progress bar helped users to control the booking process
- I included an inline validation to inform users about errors and avoid losing time trying to understand why the “continue” remains disabled (which happened during a usability test)
Things I would have done differently
- For my UX design course I was proposed to design a flow diagram for a single “happy path”. Ideally, I would have liked to include all possible paths.
- I would have preferred to start designing my wireframes after completely finishing my prototype and usability tests. It would have helped me to avoid coming back and forth and redoing my work multiple times
- I would also design the sorting abilities differently, as they are still not obvious to the users as revealed during usability tests
- Ideally, I would have liked to test my final prototype on a wider audience to make sure it worked for a variety of people